vscode-js-debug
 vscode-js-debug copied to clipboard
Support ability to jump to symbol definition from Variables and Watches views
- VS Code Version: 1.32.1
Steps to reproduce:
- Debug and go to Variables or Watch window.
- The values and types for various objects are show.
- Hookup the type of the value to the Go to Symbol in Workspace (CTRL+T) of VS Code to be able to jump to the declaration.

Eclipse JDT debugger supports this for Java in Variables and Expressions (aka Watch) views - Open Actual Type
Chrome devtools supports this. My request is to support this but in the context menu of value's type e.g. AppComponent -
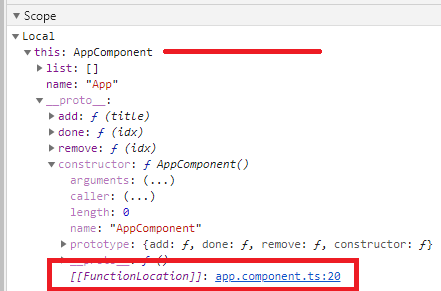
We would not be able to hook up "go to symbol" in general since as a debugger we have no such symbol registry. However, functions do give us that internal [[FunctionLocation]] which I can see would be useful to expose in the debugger.
For https://github.com/microsoft/vscode-js-debug/issues/838#issue-735587588 wont the Source map help in any way?
Not really, since sourcemaps don't tell us where any given symbol is declared, they just map locations to other locations.
I realized we probably need a DAP feature for this, so opened https://github.com/microsoft/debug-adapter-protocol/issues/368
Related: https://code.visualstudio.com/updates/v1_93#_jump-to-variable-definition and https://code.visualstudio.com/updates/v1_93#_debug-adapter-protocol
Ah, yes, thanks for the ping. This would be covered by https://github.com/microsoft/vscode-js-debug/pull/2056