vscode-js-debug
 vscode-js-debug copied to clipboard
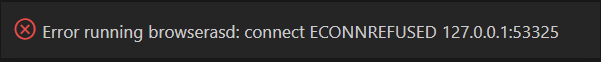
ECONNREFUSED when Chrome launches with a "Restore pages?" prompt
Describe the bug I am super confused as to what I am supposed to do here. Bug submitting is different across the repos and I started with vscode. I did not expect a different form.
Here is what I have touched: there is an issue of the same name that is closed but has 2 comments after it was closed: Issue 1184. This issue was linked to from this issue "Error running browser: connect ECONNREFUSED 127.0.0.1:41613": Issue 930. According to this page Submitting Bugs and Suggestions, I should look for duplicate issues. My issue seems to be a duplicate so not sure how to proceed. I am not entirely sure what to do with a duplicate issue for an issue that is already closed. My inference from this request was to piggy back on the existing issue so I left my original comment there as duplicate issues are frowned upon - don't know. the duplicate issue comment threw me off. please don't yell at me if I did the wrong thing. I will fix if you kindly suggest how I can fix anything I did incorrectly.
To Reproduce Steps to reproduce the behavior:
- Start a node server on port 3000
- Use launch.json to debug with browser on localhost:3000
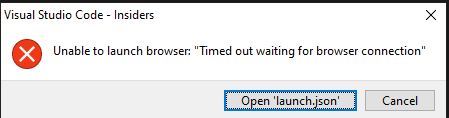
- Browser opens, shows "about:blank" and then closes.
- 2 alerts popup - one looks native to vs code and the other to windows.
Log File
I added trace to the launch for chrome browser but there is no log in the debug console. I tested the flag with other configurations in launch.json and I saw it work so I believe I have the flag in the correct place. IF so, nothing.
{ "name": "debug client-side", "type": "pwa-chrome", "request": "launch", "url": "http://localhost:3000", "trace": true }
However, when I add the flag to the server launch, the server won't start and I get this in the console:

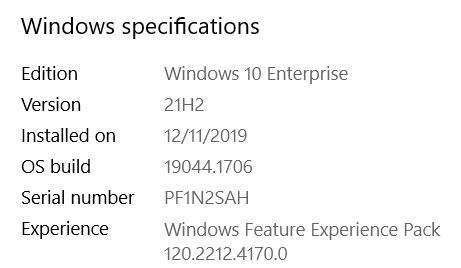
VS Code Version:
Additional context Launching the browser does not always fail so this issue is intermittent but it fails enough it is unusable by me and currently I can't get a successful launch at all.
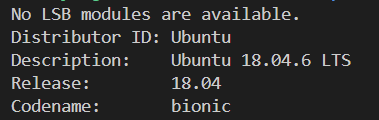
Same issue here debugging from WSL.
launch.json
{
  "version": "0.2.0",
  "configurations": [
    {
      "type": "msedge", // same with "chrome", "pwa-msedge", & "pwa-chrome"
      "request": "launch",
      "name": "Client debugger",
      "url": "http://localhost:3000"
    }
  ]