vscode-java-debug
 vscode-java-debug copied to clipboard
Debugger not working inside stream().map() expression
When debugging inside stream().map() the debugger is not working. Firstly, when the breakpoint is added it is red and looks like a proper breakpoint, however, once the debugging session is started it turns to the unverified breakpoint. Everything worked fine for me a few days ago. So I am not sure if it is on my end or the extension.
Environment
- Operating System: Win10
- JDK version: Eclipse Adoptium jdk-11.0.14.101-hotspot
- Visual Studio Code version: 1.65.0
- Java extension version: 0.21.0
- Java Debugger extension version: 0.38.0
Steps To Reproduce
- Create a stream().map() expression
ArrayList<Integer> myNumbers = new ArrayList<Integer>();
myNumbers.add(10);
myNumbers.add(15);
myNumbers.add(20);
myNumbers.add(25);
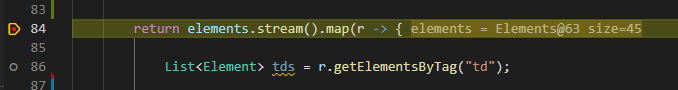
myNumbers.stream().map(e -> {
System.out.println(e.toString()); // breakpoint
System.out.println(e.toString()); // breakpoint
System.out.println(e.toString()); // breakpoint
return null;
});
- Put a breakpoint and run the code using the debugger.
- The debugger doesn't stop inside the map.
Current Result
Doesn't stop inside the map
Expected Result
It should allow to debug the code inside the map.
Additional Informations
tried reinstalling the extension, cleaning the Java server language workspace. Still the issue persists
@SimonasPetk thanks for reaching out. I cannot reproduce it. Could you try a different project to see if it's environment issue or project issue? thanks.
@testforstephen Thanks for your answer!
It persists through the environment, tried it with three different java projects.
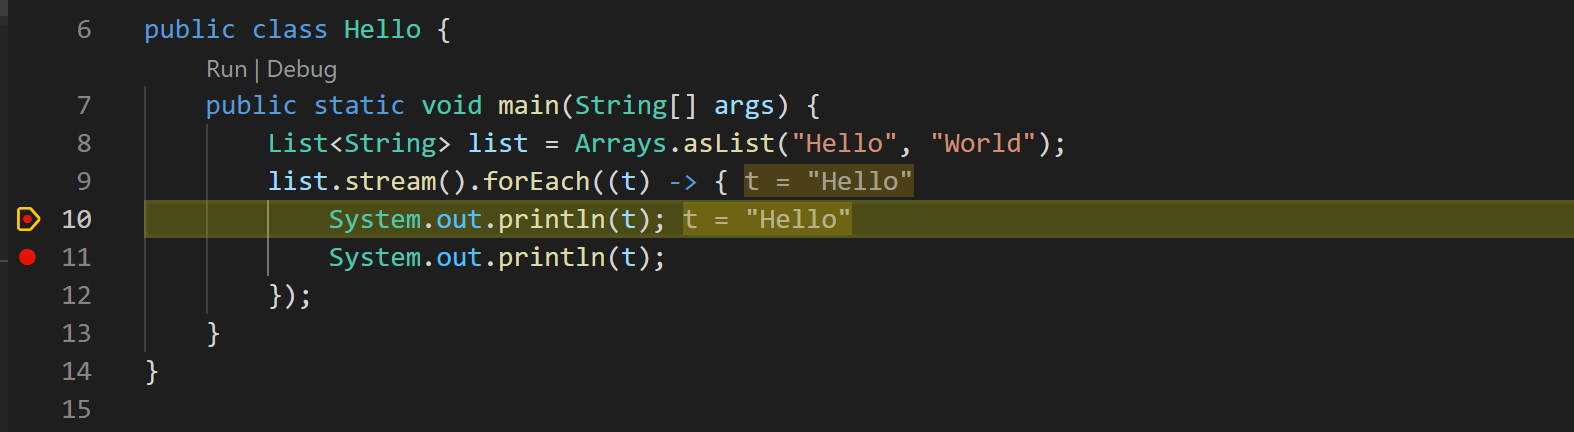
The strange thing is that stream().forEach() loop is debugged perfectly (as in your example), the problem (at least for me) only exists with the stream().map().
Should I just try to reinstall VSCode or can there be any other simpler solutions?
I tried stream().map(), although the breakpoint is shown as verified, that breakpoint are not stopped as well. It should be a bug.
I can certainly recall it working before, I think it might have appeared with the latest VS Code update.
I also have this situation after upgrading vscode these days.
stream().map() is failed, but stream().forEach()is ok.
Environment
- Operating System: Linux
- JDK version: OpenJDK Runtime Environment (build 17+35-2724)
- Visual Studio Code version: 1.65.2
- Language Support for Java(TM) by Red Hat: v1.4.0
- Java Debugger extension version: 0.38.0


I also have this situation after upgrading vscode these days.
stream().map()is failed, butstream().forEach()is ok.Environment
- Operating System: Linux
- JDK version: OpenJDK Runtime Environment (build 17+35-2724)
- Visual Studio Code version: 1.65.2
- Language Support for Java(TM) by Red Hat: v1.4.0
- Java Debugger extension version: 0.38.0
I try to rollback to Language Support for Java(TM) by Red Hat v1.3.0, it work perfectly
it is still not fixed in version Language Support for Java(TM) by Red Hat v1.6.0 @testforstephen
@testforstephen Similar problem in vertx future compose. https://vertx.io/docs/apidocs/io/vertx/core/Future.html#compose-java.util.function.Function-
While debugging tests from https://github.com/microsoft/vscode-java-test In compose, breakpoints turn grey as soon as debug session starts. It shows unverified breakpoint.
From the logs of java LSP: "command": "vscode.java.inferLaunchCommandLength",
{
    "name": "Launch Java Tests - testMethod(Vertx, VertxTestContext)",
    "type": "java",
    "request": "launch",
    "mainClass": "org.eclipse.jdt.internal.junit.runner.RemoteTestRunner",
    "projectName": "proj",
    "cwd": "/Users/foo/company/proj",
    "classPaths": [
        "/Users/foo/company/proj/target/test-classes",
        "/Users/foo/company/proj/target/classes"
    ],
    "modulePaths": [],
    "args": "-version 3 -port 49441 -testLoaderClass org.eclipse.jdt.internal.junit5.runner.JUnit5TestLoader -loaderpluginname org.eclipse.jdt.junit5.runtime -test com.company.DTest:testMethod(io.vertx.core.Vertx,io.vertx.junit5.VertxTestContext)",
    "vmArgs": "-ea -javaagent:/Users/foo/.m2/repository/org/jacoco/jacoco-0.8.8/lib/jacocoagent.jar=destfile=target/jacoco.exec",
    "env": {
    },
    "noDebug": false,
    "__progressId": "39b34b8f-239e-4293-864c-ea4a7a8f9175",
    "console": "internalConsole",
    "javaExec": "/Library/Java/JavaVirtualMachines/temurin-8.jdk/Contents/Home/bin/java"
}
javadoc about Stream:
To perform a computation, stream operations are composed into a stream pipeline. A stream pipeline consists of a source (which might be an array, a collection, a generator function, an I/O channel, etc), zero or more intermediate operations (which transform a stream into another stream, such as filter(Predicate)), and a terminal operation (which produces a result or side-effect, such as count() or forEach(Consumer)). Streams are lazy; computation on the source data is only performed when the terminal operation is initiated, and source elements are consumed only as needed.
Streams are lazy and only performed when it ends with a terminal operation. In other words, if a Stream ends with map(), which is not a terminal operation, the stream pipeline will do nothing.
You can search key word "terminal operation" in Stream javadoc for supported terminal operations. Obviously "forEach" is a terminal operation, that explains why breakpoints inside "forEach" work.
This issue is by design.
@testforstephen
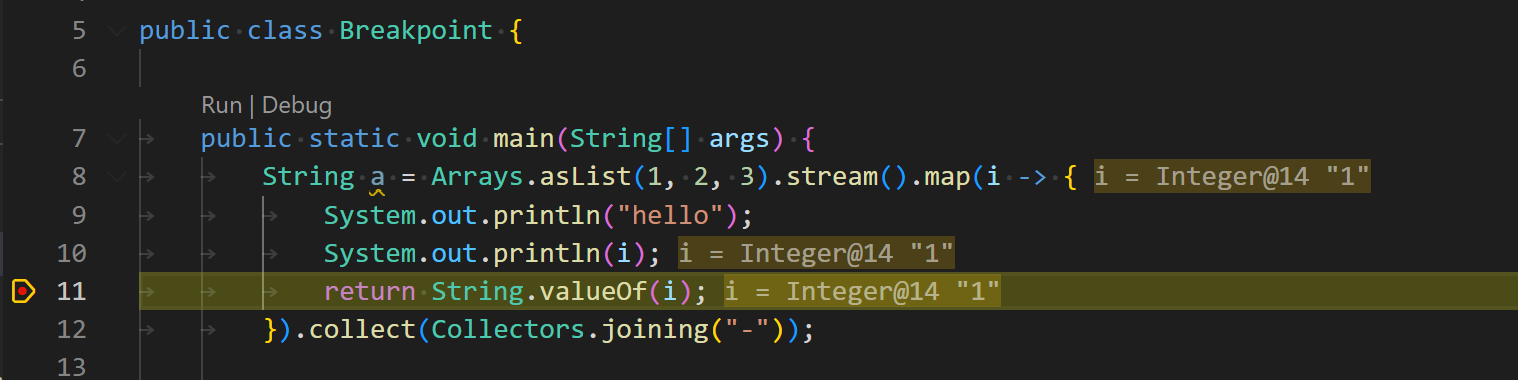
if the stream has a .map() in the middle and ends with a terminal operation (.reduce(), **.collect()**, .sum(), .toArray() , etc..) The debugger should work, as the stream pipeline is executed, is this correct?
If so, a debugger on a map still does not work. Look at @qw623577789 example above, it includes a terminal operation at the end (.collect()) and still decides to skip it.
Tested it myself and still can confirm that it doesn't work.
If the debugger shouldn't work at all in a .map() whether the stream is executed or not, why did it work before then, and what was the reasoning?
Thanks!:)
I tried @qw623577789 example above with latest debugger version (pre-release version v0.46.2022112102), it works for me.
@SimonasPetk pls make sure both redhat Java language support and debugger extension are updated to latest version.