vscode-cpptools
 vscode-cpptools copied to clipboard
Unable to start debugging on windows7
Environment
- OS and version: Windows 7 with SP1
- VS Code: 1.70.2
- C/C++ extension: v1.12.1 (Pre-release)
- OS and version of remote machine (if applicable): None
- GDB / LLDB version: 11.1 (with mingw64 from msys64)
Bug Summary and Steps to Reproduce
Bug Summary: My old PC still has a win7 operating system but I don't want to upgrade, I had got a error like 'Language Server crashed for 5 times', then I installed a newer .NET runtime which works. The langauge server works properly but when I tried to debug, Cpptools did not give any response, even a error log or messagebox. It just compile the program and then disappear, I'm sure that I have the gcc and gdb installed with the correct env variables. I've tried to write launch.json by myself, but it didn't give any response as the situation above
Steps to reproduce:
- In this environment...
- With this config...
- Do '...'
- See error...
Debugger Configurations
{
    "tasks": [
        {
            "type": "cppbuild",
            "label": "C/C++: g++.exe 生成活动文件",
            "command": "C:\\msys64\\usr\\bin\\g++.exe",
            "args": [
                "-fdiagnostics-color=always",
                "-g",
                "${file}",
                "-o",
                "${fileDirname}\\${fileBasenameNoExtension}.exe"
            ],
            "options": {
                "cwd": "${fileDirname}"
            },
            "problemMatcher": [
                "$gcc"
            ],
            "group": {
                "kind": "build",
                "isDefault": true
            },
            "detail": "调试器生成的任务。"
        }
    ],
    "version": "2.0.0"
}

{
    // 使用 IntelliSense 了解相关属性。
    // 悬停以查看现有属性的描述。
    // 欲了解更多信息,请访问: https://go.microsoft.com/fwlink/?linkid=830387
    "version": "0.2.0",
    "configurations": [
        {
            "name": "(gdb) 启动",
            "type": "cppdbg",
            "request": "launch",
            "program": "${workspaceFolder}/${fileBasenameNoExtension}.exe",
            "args": [],
            "stopAtEntry": false,
            "cwd": "${fileDirname}",
            "environment": [],
            "externalConsole": false,
            "MIMode": "gdb",
            "miDebuggerPath": "/path/to/gdb",
            "setupCommands": [
                {
                    "description": "为 gdb 启用整齐打印",
                    "text": "-enable-pretty-printing",
                    "ignoreFailures": true
                },
                {
                    "description":  "将反汇编风格设置为 Intel",
                    "text": "-gdb-set disassembly-flavor intel",
                    "ignoreFailures": true
                }
            ],
            "logging": {
                "engineLogging": true,
                "trace": true,
                "traceResponse": true
            }
        }
    ]
}
Debugger Logs
It doesn't start a new terminal window, or output any log even if I've set the above settings to the launch.json
Other Extensions
I found others work properly and no extension collision
Additional Information
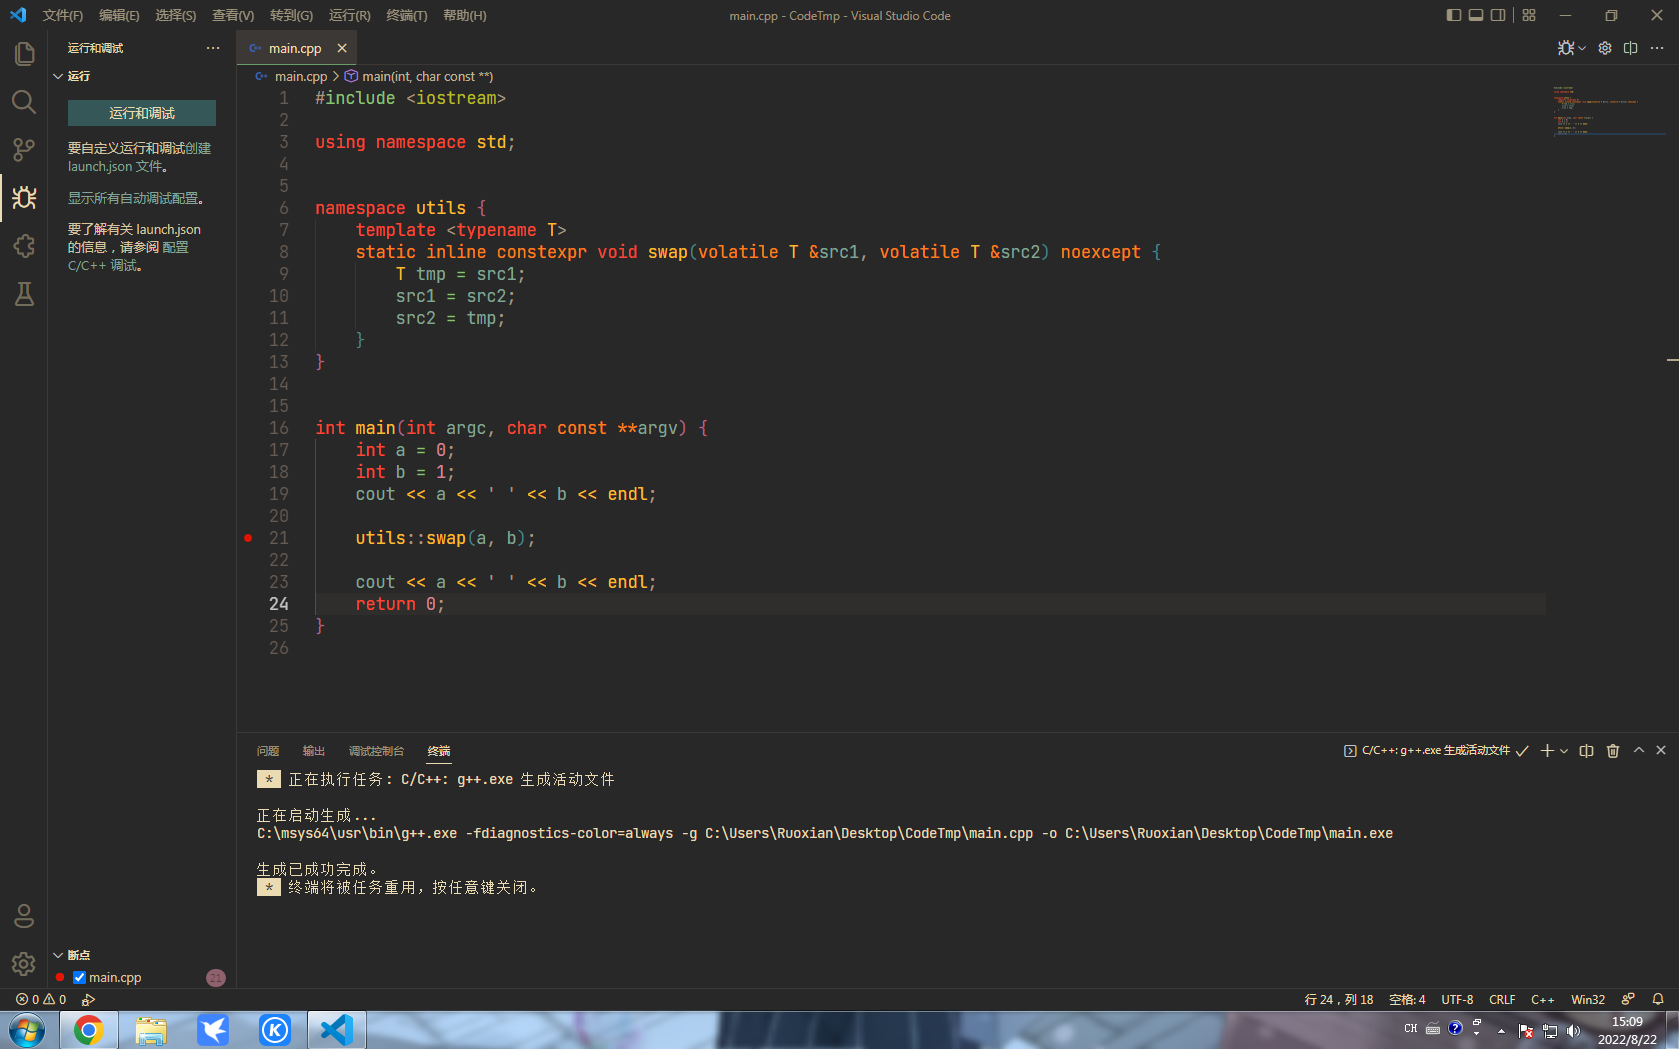
After I click the button on the top right, It compiles the program and then stucks here, nothing was happened, no logs, no errors and no debug session, Everything is the same as when the button hadn't been clicked
This setting seems incorrect -- "miDebuggerPath": "/path/to/gdb", -- are you able to provide a valid value?
The configuration file above may be unused, on my win11 pc, I don't need to write this, it will be generated automatically, I tried to change the option "miDebuggerPath" to "gdb" as I've add directory "C:\msys64\usr\bin" which contains the gdb executable to path, but I got the same result, I also use a win7 virtual machine, and I install the same C++ toolchain, the same as above. I don't think it's an exception on my computer, maybe I should lower my version of cpptools
@RuoXian233 Do you know the latest version that works?
@WardenGnaw Debugging may have regressed on Win7?
I have exactly the same problem, too.
OS and version: Windows 7, but I'm not sure if it's SP1 or not VS Code: 1.70.2 and I believe I also tested a lower version C/C++ extension: v1.13.0 GDB / LLDB version: both 8.1.0 and 12.2.0
It's strange that I can debug python programs.
This issue has been closed as lower priority. We're sorry if this issue still impacts you but unfortunately we're not able to address this. We will accept a pull request from the community if it's applicable for this issue.