vscode-cpptools
 vscode-cpptools copied to clipboard
std::vector size is missing in visualization
Environment
- OS and version: Fedora 35
- VS Code: 1.69.0
- C/C++ extension: C/C++
- GDB / LLDB version: GNU gdb (GDB) Fedora 12.1-1.fc35
Bug Summary and Steps to Reproduce
Bug Summary:
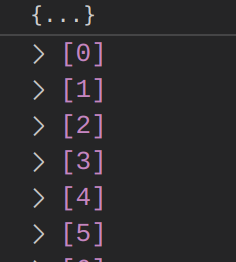
Hovering over a std::vector just shows {...}, where it should give the size. This is frustratingly ambiguous:
- If the vector is empty it shows only
{...} - If the debugger is broken and the output can't be parsed it shows only
{...} - One has to deduce the length by scrolling down to see the last index
- If there are more than 999 items, there is no way to know the length
Perhaps this used to work, but parsing of the following, e.g. from the debug console, is failing (?):
-exec p myvector
$1 = std::vector of length 73, capacity 169 = { <items> }
Steps to reproduce:
- Set up gdb pretty printing as in https://github.com/microsoft/vscode-cpptools/issues/69
- Create a dummy source file with std::vector, empty or full
- Compile, build, launch debugger
- Hover over the std::vector variable, find it in "Locals" or add a "Watch". See that there is only
{...}
Debugger Configurations
{
    // Use IntelliSense to learn about possible attributes.
    // Hover to view descriptions of existing attributes.
    // For more information, visit: https://go.microsoft.com/fwlink/?linkid=830387
    "version": "0.2.0",
    "configurations": [
        {
            "name": "Launch (cppdbg)",
            "type": "cppdbg",
            "MIMode": "gdb",
            "request": "launch",
            "cwd": "${workspaceFolder}",
            "program": "${workspaceFolder}/a.out",
            "stopAtEntry": false,
            "externalConsole": false,
            "setupCommands": [
                {
                    "description": "Enable pretty-printing for gdb",
                    "text": "-enable-pretty-printing",
                    "ignoreFailures": true
                },
                {
                    "description": "Set Disassembly Flavor to Intel",
                    "text": "-gdb-set disassembly-flavor intel",
                    "ignoreFailures": true
                },
                {
                    "description": "Don't stop on SIGUSR1",
                    "text": "handle SIGUSR1 nostop noprint pass",
                    "ignoreFailures": true
                }
            ],
        }
    ]
}
Debugger Logs
=thread-group-added,id="i1"
GNU gdb (GDB) Fedora 12.1-1.fc35
Copyright (C) 2022 Free Software Foundation, Inc.
License GPLv3+: GNU GPL version 3 or later <http://gnu.org/licenses/gpl.html>
This is free software: you are free to change and redistribute it.
There is NO WARRANTY, to the extent permitted by law.
Type "show copying" and "show warranty" for details.
This GDB was configured as "x86_64-redhat-linux-gnu".
Type "show configuration" for configuration details.
For bug reporting instructions, please see:
<https://www.gnu.org/software/gdb/bugs/>.
Find the GDB manual and other documentation resources online at:
    <http://www.gnu.org/software/gdb/documentation/>.

For help, type "help".
Type "apropos word" to search for commands related to "word".
=cmd-param-changed,param="history save",value="on"
=cmd-param-changed,param="history filename",value="/home/pknowles/.gdb_history"
Warning: Debuggee TargetArchitecture not detected, assuming x86_64.
=cmd-param-changed,param="pagination",value="off"

This GDB supports auto-downloading debuginfo from the following URLs:
https://debuginfod.fedoraproject.org/
Enable debuginfod for this session? (y or [n]) [answered N; input not from terminal]
Debuginfod has been disabled.
To make this setting permanent, add 'set debuginfod enabled off' to .gdbinit.
Stopped due to shared library event (no libraries added or removed)
Loaded '/lib64/ld-linux-x86-64.so.2'. Symbols loaded.
[Thread debugging using libthread_db enabled]
Using host libthread_db library "/lib64/libthread_db.so.1".
Other Extensions
No response
Additional Information
No response
Thank you for reporting this. We will look into displaying the string that GDB returns with print.
For a workaround, you can use Natvis.
You will need to disable GDB pretty printing in setupCommands and add the following to your launch.json.
      "showDisplayString": true,
      "visualizerFile": "${workspaceFolder}/MyCustom.natvis"
Here is an example one for std::vector
<?xml version="1.0" encoding="utf-8"?>
<AutoVisualizer xmlns="http://schemas.microsoft.com/vstudio/debugger/natvis/2010">
<Type Name="std::vector<*>">
<DisplayString>{{ size={_M_impl._M_finish - _M_impl._M_start} }}</DisplayString>
<Expand>
<Item Name="[capacity]" ExcludeView="simple">_M_impl._M_finish - _M_impl._M_start</Item>
<ArrayItems>
<Size>_M_impl._M_finish - _M_impl._M_start</Size>
<ValuePointer>_M_impl._M_start</ValuePointer>
</ArrayItems>
</Expand>
</Type>
</AutoVisualizer>
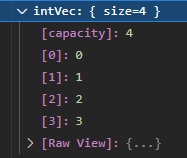
Here is what it would look with natvis.
@WardenGnaw i just want to point out that capacity and size are two entirely different things in STL.
@WardenGnaw: notifying because I see that there is no one assigned to the case.
Tested using GNU gdb (Ubuntu 12.1-0ubuntu1~22.04) 12.1 and VSCode 1.88.0-insiders:
Seems like vscode runs the gdb mi command -var-create during debugging to populate the variables view, for a std::vector<double> named doubles, the result of it is:
1: (396816) <-1122-var-create - * "doubles"
--> E (output): {"type":"event","event":"output","body":{"category":"console","output":"1: (396817) ->1122^done,name="var80",numchild="0",value="{...}",type="std::vector<double, std::allocator >",thread-id="1",displayhint="array",dynamic="1",has_more="1"\n"},"seq":1397}
It looks like the var-create does not make use of the pretty printers registered in any way. Because a: -exec p doubles prints the following:
$1 = std::vector of length 3, capacity 4 = {40, 50, 60}
1: (349680) <-1036-interpreter-exec console "p doubles"
--> E (output): {"type":"event","event":"output","body":{"category":"console","output":"1: (349681) ->~\"$1 = KH! std::vector of length 3, capacity 4 = {40, 50, 60}\\n\"\n"},"seq":546}
1: (349681) ->~"$1 = KH! std::vector of length 3, capacity 4 = {40, 50, 60}\n"
NOTE: visualization of contained elements seem to utilize the pretty printer thou, tried modifying the item visualization in the pretty printer and that clearly shows up in the variables/locals view when expanding the std::vector, the result of it's use of -var-list-children seem to use the pretty printing, note the "KH!!!" prefix under name and exp
1: (9458) <-1035-var-list-children --simple-values "var6" 0 1000
--> E (output): {"type":"event","event":"output","body":{"category":"console","output":"1: (9459) ->1035^done,numchild=\"3\",displayhint=\"array\",children=[child={name=\"var6.KH!! [0]\",exp=\"KH!! [0]\",numchild=\"0\",value=\"40\",type=\"double\",thread-id=\"1\"},child={name=\"var6.KH!! [1]\",exp=\"KH!! [1]\",numchild=\"0\",value=\"50\",type=\"double\",thread-id=\"1\"},child={name=\"var6.KH!! [2]\",exp=\"KH!! [2]\",numchild=\"0\",value=\"60\",type=\"double\",thread-id=\"1\"}],has_more=\"0\"\n"},"seq":529}