terminal
 terminal copied to clipboard
One terminal tab hangs, Terminal works until I close the frozen tab - then whole Terminal hangs
Windows Terminal version
1.13.11431.0
Windows build number
10.0.19044.1766
Other Software
wsl (Debian), docker 20.10.12, build e91ed57 docker-compose 1.29.2, build 5becea4c
Steps to reproduce
Happens randomly, but takes long time, so I cannot find 100% working way to reproduce. Probably not related to docker and compose, I suspect it's more about long output and hibernating.
- Start docker-compose in detached mode with many containers producing a lot of logs on a wsl tab
- Start docker-compose logs -f
- Let it live for several hours
- Just in case - open another terminal tabs (I think that's what I always do)
- Hibernate computer (S4 power state)
- Wake up computer (maybe after a while? maybe a date change is required? I don't know, I usually hibernate it in the evening and wake up in the morning)
Expected Behavior
No response
Actual Behavior
Single tab with wsl and docker-compose command freezes.
Docker containers keep working (expected). Terminal as a whole works (I can switch tabs, use other tabs). When I click [X] to close the frozen tab whole Terminal feezes and I need to kill it.
It started happening around 2 months ago, it was just fine previously, I'm using Terminal for the same things since it was added to the MS Store.
One more thing I forgot to mention: when tab is frozen I can't even select the text on it.
I recorded a screencast to maybe help visualize the problem:
https://user-images.githubusercontent.com/4936805/176145073-80fcf8f5-6208-479d-ada1-be5ab6248e7c.mp4
Would you happen to have an NVidia graphics card/? This kinda feel like the repro for #12607, but that only seems to occur on nvidia hardware.
No, I don't have graphicd card at all, just the CPU: 11th Gen Intel(R) Core(TM) i5-1135G7 @ 2.40GHz.
64 GB of RAM, around ~50% of it is used most of the time, but I don't see increased usage when Terminal hangs. Shouldn't be too much for Terminal, but such stuff happens as well, so I'm mentioning it, because I didn't put the specs in the original post.
Butts. When the Terminal is frozen like this, could you grab a dump with Task Manager and send it to us/?

This doesn't look like the Terminal is struggling for resources, this looks like your bog-standard deadlock. Just gotta figure out where.
I will send you a dump next time it happens. Is it safe to send it here, to the public?
It might have PII in it, definitely including whatever output was in the Terminal at the time. You can email it to me (my email address is in my profile), with the usual caveats of security that accompany email. If you're cool with that, ping me here when you send it. Otherwise, I think there's a way to upload files to a Feedback hub report, but I don't know how off the top of my head. That would be secure for sure, but less convenient. Pick your poison 😋
This issue has been automatically marked as stale because it has been marked as requiring author feedback but has not had any activity for 4 days. It will be closed if no further activity occurs within 3 days of this comment.
@zadjii-msft
If you're cool with that, ping me here when you send it.
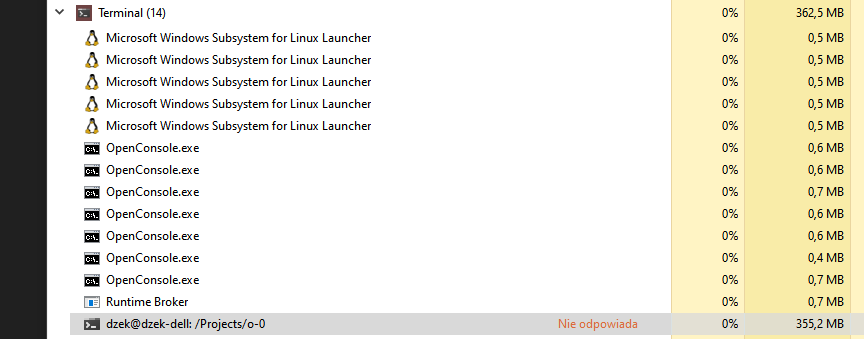
I have the dump. It's over 700MB big, so I guess I can't push them via e-mail, but I can host them somewhere accessible via https and just send you the link via e-mail. I took the dump of frozen process (Not responding in orange), it has different title and icon than your screenshot but I guess this is the one you need.
So, do you want me to send you a specific mail topic or something?
it has different title and icon than your screenshot
Yep that looks like the right wt.exe process!
send you the link via e-mail
That'll work. Just include the issue number or "Terminal" or something in the subject line and ping me here, I should be able to figure it out. Thanks!
Hmm.
Main thread:
0:000> k
 # Child-SP          RetAddr               Call Site
00 000000f8`5c8feab8 00007ffa`2d561ace     ntdll!ZwWaitForSingleObject+0x14 [minkernel\ntdll\daytona\objfre\amd64\usrstubs.asm @ 211]
01 000000f8`5c8feac0 00007ff9`b3ede979     KERNELBASE!WaitForSingleObjectEx+0x8e [minkernel\kernelbase\synch.c @ 1328]
02 (Inline Function) --------`--------     Microsoft_Terminal_Control!Microsoft::Console::Render::RenderThread::WaitForPaintCompletionAndDisable+0x17 [C:\a\_work\1\s\src\renderer\base\thread.cpp @ 298]
03 000000f8`5c8feb60 00007ff9`b3e84214     Microsoft_Terminal_Control!Microsoft::Console::Render::Renderer::TriggerTeardown+0x41 [C:\a\_work\1\s\src\renderer\base\renderer.cpp @ 332]
04 000000f8`5c8feba0 00007ff9`b3e85fb4     Microsoft_Terminal_Control!winrt::Microsoft::Terminal::Control::implementation::ControlCore::~ControlCore+0x34 [C:\a\_work\1\s\src\cascadia\TerminalControl\ControlCore.cpp @ 206]
05 000000f8`5c8febd0 00007ff9`b3e69173     Microsoft_Terminal_Control!winrt::Microsoft::Terminal::Control::implementation::ControlCore::`scalar deleting destructor'+0x14
06 (Inline Function) --------`--------     Microsoft_Terminal_Control!winrt::impl::root_implements<winrt::Microsoft::Terminal::Control::implementation::ControlCore,winrt::Microsoft::Terminal::Control::ControlCore,winrt::Microsoft::Terminal::Control::ICoreState>::NonDelegatingRelease+0x44682 [C:\a\_work\1\s\src\cascadia\TerminalControl\Generated Files\winrt\base.h @ 7385]
07 (Inline Function) --------`--------     Microsoft_Terminal_Control!winrt::impl::root_implements<winrt::Microsoft::Terminal::Control::implementation::ControlCore,winrt::Microsoft::Terminal::Control::ControlCore,winrt::Microsoft::Terminal::Control::ICoreState>::Release+0x44682 [C:\a\_work\1\s\src\cascadia\TerminalControl\Generated Files\winrt\base.h @ 7266]
08 (Inline Function) --------`--------     Microsoft_Terminal_Control!winrt::implements<winrt::Microsoft::Terminal::Control::implementation::ControlCore,winrt::Microsoft::Terminal::Control::ControlCore,winrt::Microsoft::Terminal::Control::ICoreState>::Release+0x44682 [C:\a\_work\1\s\src\cascadia\TerminalControl\Generated Files\winrt\base.h @ 7859]
09 000000f8`5c8fec00 00007ff9`b3e94620     Microsoft_Terminal_Control!winrt::com_ptr<winrt::Microsoft::Terminal::Control::implementation::ControlCore>::unconditional_release_ref+0x4468f [C:\a\_work\1\s\src\cascadia\TerminalControl\Generated Files\winrt\base.h @ 2544]
0a (Inline Function) --------`--------     Microsoft_Terminal_Control!winrt::com_ptr<winrt::Microsoft::Terminal::Control::implementation::ControlCore>::release_ref+0xb [C:\a\_work\1\s\src\cascadia\TerminalControl\Generated Files\winrt\base.h @ 2538]
0b (Inline Function) --------`--------     Microsoft_Terminal_Control!winrt::com_ptr<winrt::Microsoft::Terminal::Control::implementation::ControlCore>::{dtor}+0xb [C:\a\_work\1\s\src\cascadia\TerminalControl\Generated Files\winrt\base.h @ 2370]
Looks locked in a teardown of a renderer, waiting on _hPaintCompletedEvent. There's 8 renderer threads, lets see...
Looks like in the main thread, the control that's dtoring:
0:000> dx -r1 (*((Microsoft_Terminal_Control!std::unique_ptr<Microsoft::Console::Render::RenderThread,std::default_delete<Microsoft::Console::Render::RenderThread> > *)0x2c7f0b865a0))
(*((Microsoft_Terminal_Control!std::unique_ptr<Microsoft::Console::Render::RenderThread,std::default_delete<Microsoft::Console::Render::RenderThread> > *)0x2c7f0b865a0))                 : unique_ptr {...} [Type: std::unique_ptr<Microsoft::Console::Render::RenderThread,std::default_delete<Microsoft::Console::Render::RenderThread> >]
    [<Raw View>]     [Type: std::unique_ptr<Microsoft::Console::Render::RenderThread,std::default_delete<Microsoft::Console::Render::RenderThread> >]
    [ptr]            : 0x2c7f0a98a10 [Type: Microsoft::Console::Render::RenderThread *]
    [deleter]        : default_delete [Type: std::_Compressed_pair<std::default_delete<Microsoft::Console::Render::RenderThread>,Microsoft::Console::Render::RenderThread *,1>]
    [+0x000] _hThread         : 0xb60 [Type: void *]
    [+0x008] _hEvent          : 0xb84 [Type: void *]
    [+0x010] _hPaintEnabledEvent : 0xb6c [Type: void *]
    [+0x018] _hPaintCompletedEvent : 0xb70 [Type: void *]
Dunno if I can take the handle to the thread and just get the TID straight away. in the debugger
the second, 0x413c is in the middle of a paint frame.
And y'know what, its _hThread is 0xb60 so this is probably the one that's supposed to be tearing down.
...
0:010> k
 # Child-SP          RetAddr               Call Site
00 000000f8`5cdff388 00007ffa`295f3c3a     win32u!ZwGdiDdDDIWaitForSynchronizationObjectFromCpu+0x14 [onecoreuap\windows\core\umode\moderncore\objfre\amd64\usrstubs.asm @ 5022]
01 000000f8`5cdff390 00007ffa`295f3840     d3d11!CallAndLogImpl<long (__cdecl*)(_D3DKMT_WAITFORSYNCHRONIZATIONOBJECTFROMCPU const *),_D3DKMT_WAITFORSYNCHRONIZATIONOBJECTFROMCPU *>+0x12 [onecoreuap\windows\directx\dxg\d3d11\D3DCore\Inc\pch.hpp @ 543]
02 (Inline Function) --------`--------     d3d11!CallAndLog+0x10 [onecoreuap\windows\directx\dxg\d3d11\D3DCore\Inc\pch.hpp @ 591]
03 000000f8`5cdff3f0 00007ffa`21dd5e72     d3d11!NDXGI::CDevice::WaitForSynchronizationObjectFromCpuCB+0x60 [onecoreuap\windows\directx\dxg\d3d11\d3dcore\lowfreq\dxgidevice.cpp @ 9808]
04 000000f8`5cdff480 00007ffa`215aa601     igd10iumd64!GTPin_Init+0x155092
05 000000f8`5cdff4e0 00007ffa`213b0dd6     igd10iumd64!OpenAdapter10_2+0x2f01e1
06 000000f8`5cdff520 00007ffa`213b0312     igd10iumd64!OpenAdapter10_2+0xf69b6
07 000000f8`5cdff560 00007ffa`212bb47a     igd10iumd64!OpenAdapter10_2+0xf5ef2
08 000000f8`5cdff5c0 00007ffa`212bb2d5     igd10iumd64!OpenAdapter10_2+0x105a
09 000000f8`5cdff5f0 00007ffa`21cc18f5     igd10iumd64!OpenAdapter10_2+0xeb5
0a 000000f8`5cdff620 00007ffa`21cc1a5a     igd10iumd64!GTPin_Init+0x40b15
0b 000000f8`5cdff670 00007ffa`29630b79     igd10iumd64!GTPin_Init+0x40c7a
0c 000000f8`5cdff6d0 00007ffa`2b95206e     d3d11!NDXGI::CDevice::WaitForFence+0x89219 [onecoreuap\windows\directx\dxg\d3d11\d3dcore\lowfreq\dxgidevice.cpp @ 4020]
0d 000000f8`5cdff750 00007ffa`296c32d2     dxgi!CDXGISwapChain::AcquireBuffer+0xbe [onecoreuap\windows\directx\dxg\dxgi\dll\swapchan.cpp @ 6100]
0e 000000f8`5cdff790 00007ffa`295b648d     d3d11!CContext::AcquireResource+0x4a [onecoreuap\windows\directx\dxg\d3d11\d3dcore\highfreq\device_hf.cpp @ 15625]
0f 000000f8`5cdff7c0 00007ffa`296d7201     d3d11!CContext::AcquireResourceWithMaskAndGuard+0x49 [onecoreuap\windows\directx\dxg\d3d11\D3DCore\Inc\Device.inl @ 1105]
10 000000f8`5cdff7f0 00007ffa`296ffcbe     d3d11!CResource<ID3D11Resource>::CopyResource<2,6>+0x1f1 [onecoreuap\windows\directx\dxg\d3d11\D3DCore\Inc\Resource.inl @ 3849]
11 000000f8`5cdff840 00007ffa`29754256     d3d11!CContext::TID3D11DeviceContext_CopyResource_<1>+0x3e [onecoreuap\windows\directx\dxg\d3d11\d3dcore\highfreq\device_hf.cpp @ 6700]
12 000000f8`5cdff870 00007ff9`b3e214ab     d3d11!CContext::TID3D11DeviceContext_CopyResource_Amortized<1>+0x86 [onecoreuap\windows\directx\dxg\d3d11\d3dcore\highfreq\deviceamortized_hf.cpp @ 872]
13 000000f8`5cdff8e0 00007ff9`b3e21349     Microsoft_Terminal_Control!Microsoft::Console::Render::DxEngine::_CopyFrontToBack+0xc7 [C:\a\_work\1\s\src\renderer\dx\DxRenderer.cpp @ 1463]
14 000000f8`5cdff940 00007ff9`b3e166b6     Microsoft_Terminal_Control!Microsoft::Console::Render::DxEngine::Present+0x99 [C:\a\_work\1\s\src\renderer\dx\DxRenderer.cpp @ 1590]
15 000000f8`5cdff980 00007ff9`b3e162ba     Microsoft_Terminal_Control!Microsoft::Console::Render::Renderer::_PaintFrameForEngine+0x202 [C:\a\_work\1\s\src\renderer\base\renderer.cpp @ 178]
16 000000f8`5cdffa20 00007ff9`b3e16221     Microsoft_Terminal_Control!Microsoft::Console::Render::Renderer::PaintFrame+0x4a [C:\a\_work\1\s\src\renderer\base\renderer.cpp @ 78]
17 000000f8`5cdffa50 00007ffa`2f887034     Microsoft_Terminal_Control!Microsoft::Console::Render::RenderThread::_ThreadProc+0x71 [C:\a\_work\1\s\src\renderer\base\thread.cpp @ 214]
18 000000f8`5cdffa80 00007ffa`2f9c2651     kernel32!BaseThreadInitThunk+0x14 [clientcore\base\win32\client\thread.c @ 64]
19 000000f8`5cdffab0 00000000`00000000     ntdll!RtlUserThreadStart+0x21 [minkernel\ntdll\rtlstrt.c @ 1153]
That actually kinda reminds me of #12607 - it's like the main thread & render thread got "deadlocked" by waiting for the same event. The main thread waited for the renderer to do something, and in the process of painting, the renderer triggered something to get sent to the main thread to get handled. That's at least the conjecture in the other thread. I really don't know why these OpenAdapter calls seem to call back to the main thread....
https://docs.microsoft.com/en-us/windows-hardware/drivers/display/supporting-multiple-processors:
In particular, the software layer cannot batch calls to functions that return information (for example, CreateResource). When the software layer must call one of these types of driver functions, it flushes all queued commands through the worker thread, and then the software layer calls the driver function on the main application thread.
We may want to try and deal with this along with #12607. I dunno if we can just safely hang on to the renderer in the dtor and do a final_release of that on the background thread.
Heck, do we even need to do a paint in the Renderer::TriggerTeardown in the ControlCore dtor? What does that get us? The thing is already going away! We just need to disable the renderer thread so it will clean itself up.
Terminal crashes for me as well. Almost every time remote desktop then return to the desktop. Happens probably %50. If I should create a new issue lmk. Attaching dump.
This will most likely be fixed by #14959 because it doesn't call any graphics APIs while the console lock is being held.
Hello, Personally I can't answer as I'm not a Windows user anymore. Maybe @paulelong (you commented before) or @joelvaneenwyk (you reacted to the issue) can verify it now.
This issue has been automatically marked as stale because it has been marked as requiring author feedback but has not had any activity for 4 days. It will be closed if no further activity occurs within 3 days of this comment.