onnxruntime
 onnxruntime copied to clipboard
[Performance] nearest neighbor Resize operator is significantly slower than pytorch for 3D tensors
Describe the issue
I have a model that I'd like to run using onnxruntime to decrease the install size. Here's a table comparing the total time of ONNX and pytorch when running different amount of inference (time in seconds)
| 1 | 5 | 10 | 50 | 100 | |
|---|---|---|---|---|---|
| pytorch | 0.45 | 0.75 | 1.11 | 3.85 | 7.17 |
| onnxruntime | 0.26 | 0.79 | 1.51 | 6.98 | 13.87 |
To me it seems like while the first inference of pytorch is slow, sequential once are much faster compared to onnx. I believe this has to do with cudnn plans not being cached. When I digged into the pytorch code I found that the plan for convultion layers is being cached. In the run_single_conv function in Conv_v8.cpp, a function benchmark_cache.find(key); is executed which will search the cache to see if a convoltion plan with the same parameters has already been calculated. If not, it generates the plan and adds it to the cache. I was wondering if onnxruntime has something similar in place since I couldn't find this.
To reproduce
I convert the model like this:
import torch

input_data = torch.randn((1, 1, 96, 96, 96)).cuda().half()
torch.onnx.export(
    model,  # model being run
    input_data,  # model input (or a tuple for multiple inputs)
    "model.onnx",  # where to save the model (can be a file or file-like object)
    export_params=True,  # store the trained parameter weights inside the model file
    opset_version=11,  # the ONNX version to export the model to
    do_constant_folding=True,  # whether to execute constant folding for optimization
    input_names=["input"],  # the model's input names
    output_names=["output"],  # the model's output names
    keep_initializers_as_inputs=False,
)
And run inference as followes:
import onnxruntime
import numpy as np
import time

NUMBER: int = 1

opts = onnxruntime.SessionOptions()
# opts.enable_profiling = True
opts.graph_optimization_level = onnxruntime.GraphOptimizationLevel.ORT_ENABLE_EXTENDED
# opts.intra_op_num_threads = 1

ort_session = onnxruntime.InferenceSession(
    "model.onnx",
    opts,
    providers=[
        (
            "CUDAExecutionProvider",
            {
                "device_id": 0,
                # "arena_extend_strategy": "kNextPowerOfTwo",
                # "do_copy_in_default_stream": False,
                "cudnn_conv_use_max_workspace": "1",
                # "gpu_mem_limit": 4 * 1024 * 1024 * 1024,
                # "cudnn_conv1d_pad_to_nc1d": "1",
                "cudnn_conv_algo_search": "HEURISTIC",
            },
        ),
        "CPUExecutionProvider",
    ],
)
def get_data():
    return np.array(np.random.rand(1, 1, 96, 96, 96) * 20, dtype=np.float16)

# compute ONNX Runtime output prediction
start = time.time()
io_binding = ort_session.io_binding()
for i in range(NUMBER):
    io_binding.bind_cpu_input("input", get_data())
    io_binding.bind_output("output")
    ort_session.run_with_iobinding(io_binding)
    io_binding.copy_outputs_to_cpu()[0]
print(f"ONNX: {time.time() - start}")
Sadly I'm not able to share the model but I'm using a 3D Unet model similar to this model.
Urgency
No response
Platform
Linux
OS Version
Ubuntu 18.04
ONNX Runtime Installation
Released Package
ONNX Runtime Version or Commit ID
1.13.1
ONNX Runtime API
Python
Architecture
X64
Execution Provider
CUDA
Execution Provider Library Version
No response
Model File
No response
Is this a quantized model?
Yes
Update: conv.cc in providers/cuda/nn does have cached_benchmark_results which works. I've verified that after the first run, the execution plan is always found in cached_benchmark_results
@SimonRelu, could you please profile the model and see if all nodes are running on GPU?
I've verified that all models are running on CUDA.
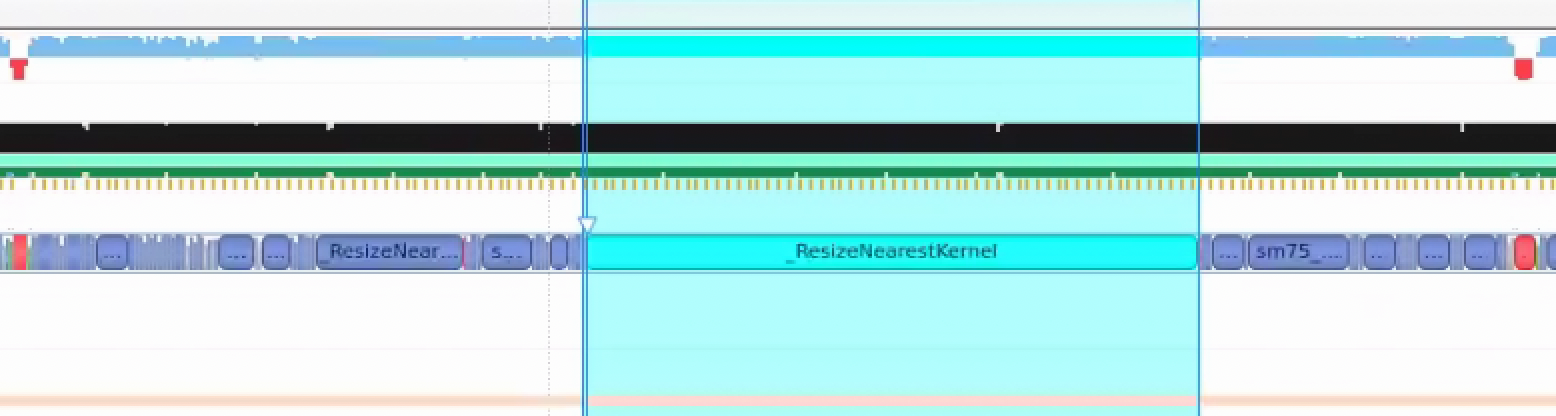
I've also profiled the model and the execution stack looks like this:

I'm viewing it with chrome://tracing/ . Does this look normal or should I use another tool?
So I have to set CUDA_LAUNCH_BLOCKING=1 since otherwise the profiler doesn't properly track CUDA execution times. With that I get this:
 The slow performance thus comes from the
 Resize op. which originally was aten::upsample_nearest3d in pytorch. Any idea why this is so much slower in onnxruntime?
Thanks for sharing the profiling result. What's the input shape and upsample scale? I'll investigate the cuda kernel. If it need improvement, we can probably update the kernel soon.
Yes, the input is:
data: Tensor[1, 128, 48, 48, 48] scale: [1, 1, 2, 2, 2] roi: empty mode: "nearest" nearest_mode: "floor"
Thank you for looking into this
Hey @tianleiwu , I was wondering if you managed to reproduce the issue and if there is still anything you need from me?
Hey, I understand that this might not be the highest priority but I was wondering when you'd be able to look into this. This issue is currently blocking us from releasing with onnxruntime. If it isn't possible to fix this in the near future I'd look into including aten::upsample_nearest3d as a custom op so we can move forward with the release. Thank you for the info :)
@SimonRelu, sorry for late response. I am looking into the issue and will let you know once there is progress.
I did some debugging; it uses block=14 and threads=32 for the input, which seems not enough. Let me check aten::upsample_nearest3d to see whether we can leverage similar partition logic.
Update: The partitions of 14 * 32 are for mapping only. For resize, it uses 442368 * 256 threads, so it is reasonable.
@zhanghuanrong, please help take a look at the resize cuda kernel since you implemented that part.
Hi, SimonRelu, could you please also using nsys profile and show us the kernel name for it, and how long each kernel runs?
Hey zhanghuanrong, the kernel is called _ResizeNearestKernel and it spend 58ms seconds there (after having several warmup inference runs) when resizing the Tensor[1, 128, 48, 48, 48].
I also resize a kernel of shape Tensor[1, 256, 24, 24, 24] and Tensor[1, 512, 12, 12, 12] which spend 13.5 ms and 3.399 ms in the _ResizeNearestKernel kernel respectively (both also with scale [1, 1, 2, 2, 2]).
Here are the kernel times cropped to one inference run (after warmup): onnx-profile.ods
hi @zhanghuanrong , thank you for looking into this. I was just wondering if you could provide an update on this. It'd be great if you could give an estimate on how long this would take since we're currently blocked by this for our release. Thanks a lot!
Hi! Any updates on this? I ran into a similar issue when using ONNX for a network with 3D convolutions and resizings coming from pytorch.
Hey, I was wondering if there is any news on this. We'd like to move foreward with our release soon so if it's not possible to fix this, I'd like to know so I can look into an alternative solution. If there is anything you still need for me to better reproduce the issue please let me know. Thank you for all the info so far.
@zhanghuanrong, is there update on this? ORT is about 6x slower based on the profiling in T4 GPU:
Profiling of Torch:
            Type  Time(%)      Time     Calls       Avg       Min       Max  Name
 GPU activities:   74.59%  1.44478s       103  14.027ms  8.2769ms  14.859ms  void at::native::_GLOBAL__N__1f4b89ac_20_UpSampleNearest3d_cu_9b21834e::upsample_nearest3d_out_frame<float, __operator_&__(at::native:                        :nearest_neighbor_compute_source_index(float, int, int))>(float const *, unsigned long, unsigned long, unsigned long, unsigned long, unsigned long, unsigned long, unsigned long, unsigned long, at::native::neares                        t_neighbor_compute_source_index*, float, float, float)
                   25.41%  492.06ms       101  4.8719ms  4.6421ms  5.4845ms  [CUDA memcpy HtoD]
      API calls:   86.11%  1.53290s       101  15.177ms  4.6994ms  1.03680s  cudaMemcpyAsync
                   12.66%  225.30ms         4  56.325ms  2.7260us  225.29ms  cudaStreamIsCapturing
                    0.46%  8.1186ms       101  80.382us  77.680us  84.393us  cudaStreamSynchronize
Profiling result of ORT:
            Type  Time(%)      Time     Calls       Avg       Min       Max  Name
 GPU activities:   94.60%  8.79115s       103  85.351ms  84.858ms  96.348ms  void onnxruntime::cuda::_ResizeNearestKernel<float>(int, onnxruntime::cuda::TArray<long, int=8>, onnxruntime::cuda::_ResizeNearestKernel<float, onnxruntime::cuda::fast_divmod, int=8>, float const *, onnxruntime::cuda::_ResizeNearestKernel<float, onnxruntime::cuda::fast_divmod, int=8>*, unsigned long, onnxruntime::cuda::_ResizeNearestKernel<float, onnxruntime::cuda::fast_divmod, int=8>, long const *, onnxruntime::cuda::NearestMappingInfo const *)
                    5.30%  492.96ms       102  4.8329ms  4.6511ms  5.2684ms  [CUDA memcpy HtoD]
                    0.00%  388.48us         1  388.48us  388.48us  388.48us  [CUDA memcpy DtoD]
                    0.00%  349.34us       103  3.3910us  3.2320us  7.2640us  void onnxruntime::cuda::_ResizeNearestMappingKernel<float, onnxruntime::cuda::TransformCoordinate_ASYMMETRIC, onnxruntime::cuda::NearestPixel_FLOOR>(unsigned long, onnxruntime::cuda::TArray<long, int=8>, onnxruntime::cuda::TArray, onnxruntime::cuda::_ResizeNearestMappingKernel<float, onnxruntime::cuda::TransformCoordinate_ASYMMETRIC<float, int                        =8>, onnxruntime::cuda::NearestPixel_FLOOR>, onnxruntime::cuda::_ResizeNearestMappingKernel<float, onnxruntime::cuda::TransformCoordinate_ASYMMETRIC<float, int=10>, onnxruntime::cuda::NearestPixel_FLOOR>, unsign                        ed long, bool, onnxruntime::cuda::TransformCoordinate_ASYMMETRIC const &, onnxruntime::cuda::NearestPixel_FLOOR const &, long*, onnxruntime::cuda::NearestMappingInfo*)
Example script for profiling:
import torch
import time

def test_torch():
    input = torch.rand(1, 128, 48, 48, 48, dtype=torch.float32, requires_grad=False).to('cuda')
    model = torch.nn.Upsample(scale_factor=2, mode='nearest').cuda()

    torch.set_grad_enabled(False)

    for _ in range(3): # warm up
        model(input)

    latency = []
    for _ in range(100):
        input = torch.rand(1, 128, 48, 48, 48, dtype=torch.float32, requires_grad=False).to('cuda') # input is in GPU
        torch.cuda.synchronize()
        start = time.time()
        output = model(input)
        torch.cuda.synchronize()
        end = time.time()
        latency.append(end-start)
    average_latency_in_ms = 1000 * sum(latency) / len(latency)
    print(f"Torch latency: {average_latency_in_ms:.2f} ms")

def export_onnx():
    input = torch.rand(1, 128, 48, 48, 48, dtype=torch.float32, requires_grad=False).to('cuda')
    model = torch.nn.Upsample(scale_factor=2, mode='nearest').cuda()
    torch.onnx.export(model, input, "upsample.onnx", input_names=["input"], output_names=["output"], opset_version=11)

def test_onnx():
    import onnxruntime
    import numpy as np
    options = onnxruntime.SessionOptions()
    session = onnxruntime.InferenceSession("upsample.onnx", options, providers=["CUDAExecutionProvider", "CPUExecutionProvider"])

    input = torch.rand(1, 128, 48, 48, 48, dtype=torch.float32, requires_grad=False).to('cuda')
    input_tensor = input.contiguous()
    output_tensor = torch.empty((1, 128, 96, 96, 96), dtype=torch.float32, device='cuda:0').contiguous()

    binding = session.io_binding()
    binding.bind_input(
        name='input',
        device_type='cuda',
        device_id=0,
        element_type=np.float32,
        shape=tuple(input_tensor.shape),
        buffer_ptr=input_tensor.data_ptr(),
        )
    binding.bind_output(
        name='output',
        device_type='cuda',
        device_id=0,
        element_type=np.float32,
        shape=tuple(output_tensor.shape),
        buffer_ptr=output_tensor.data_ptr(),
    )

    for _ in range(3): # warm up
        session.run_with_iobinding(binding)

    ort_latency = []
    for _ in range(100):
        input = torch.rand(1, 128, 48, 48, 48, dtype=torch.float32, requires_grad=False).to('cuda') # input is in GPU
        input_tensor = input.contiguous()
        start = time.time()
        binding.bind_input(
                name='input',
                device_type='cuda',
                device_id=0,
                element_type=np.float32,
                shape=tuple(input_tensor.shape),
                buffer_ptr=input_tensor.data_ptr(),
                )
        session.run_with_iobinding(binding)
        end = time.time()
        ort_latency.append(end - start)

    average_latency_in_ms = 1000 * sum(ort_latency) / len(ort_latency)
    print(f"Ort Latency: {average_latency_in_ms:.2f} ms")

#test_torch()
#export_onnx()
test_onnx()
I think one solution is to use the aten kernel for 3d upsample. @yufenglee to track this work.
I have converted a Bert variant model which onnx file more faster then pytorch model ORT into geforce rtx 3090. Below the result for 3090. but when I used Tesla T4 GPU the onnx model was slow then pytorch model.
| Text Length | PyTorch Time | ONNX Time | Percentage Improvement |
|-------------|--------------|-----------|------------------------|
| 79          | 0.714        | 0.230     | 67.86%                 |
| 177         | 0.183        | 0.098     | 46.43%                 |
| 78          | 0.293        | 0.060     | 79.45%                 |
This table presents the processing times for both PyTorch and ONNX models along with the percentage improvement in processing time when using the ONNX model over PyTorch for each respective text length.
Could You Please explain the main reason for onnx model slow into T4 GPU.
This problem has solved CUDA 12.1 and Pytroch ==2.2.1 .
I've updated the title since indd overall, onnxruntime seems to be faster but the Rescale operator for 3D tensors is significantly slower than the one in pytorch.
The reason for this is because in pytorch, there is a dedicated function for doing this for 3D (as well as 2D) tensors. In onnxruntime, only a dedicated function for 2D tensors is present. Any other tensor is handled by a more generic function which is quite a bit slower since a lot less is know at compile time leading to less optimisations: https://github.com/microsoft/onnxruntime/blob/main/onnxruntime/core/providers/cuda/tensor/upsample_impl.cu
@SimonRelu, We've added it to the backlog targeted for 1.19 release. If you have done some improvements on the kernel, feel free to submit a pull request to contribute.
Thank you for adding it to the milestone. I ported the pytorch implementation as a custom operator. It is however quite hacky and only works for our use case so I'm not sure if it's useful.
The pytorch implementation can be found here: https://github.com/pytorch/pytorch/blob/acfe237a71af609e837a34bb38048aa8acb8eb4d/aten/src/ATen/native/cuda/UpSampleNearest3d.cu#L4
Hey, I was wondering if there is an update on the status of this issue? Was this resolved in 1.19? We might want to upgrade our onnxruntime version and it would be good to know if this was resolved
@SimonRelu, it is not implemented yet. It is still in back log due to resource limit, and I'll update if there is progress.