Add functionality to label individual bars with Axes.bar()
PR Summary
Currently, if you need to label each bar in a plot say for an animation, you have to loop over the bars in the bar container that Axes.bar() returns and call set_label() on each bar. I have an example here in a workshop I deliver. When compared with stackplot() (which has a labels argument for this) this can be a gotcha for newcomers. There is a label key shown in the docs as available on the Rectangle, but it doesn't have the expected effect of labeling the bars, rather it labels the BarContainer:
>>> import matplotlib.pyplot as plt
>>> x = ["a", "b", "c"]
>>> y = [10, 20, 15]
>>> fig, ax = plt.subplots()
>>> bar_container = ax.barh(x, y, label=x)
>>> print([bar.get_label() for bar in bar_container])
['_nolegend_', '_nolegend_', '_nolegend_']
>>> bar_container.get_label()
"['a', 'b', 'c']
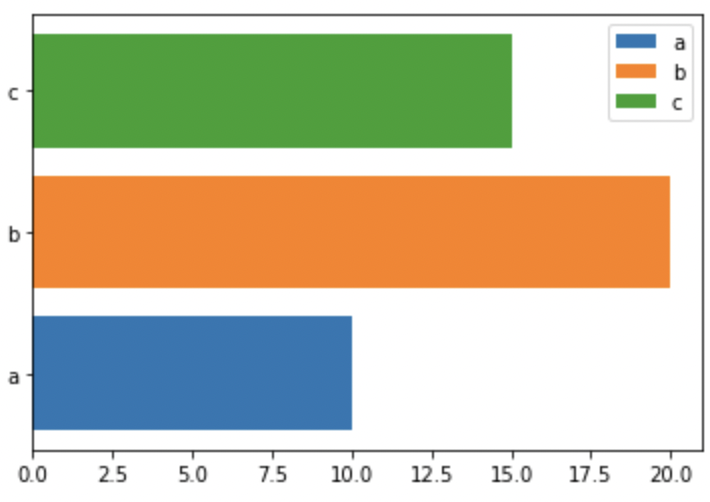
This PR adds a labels argument to Axes.bar(), which makes it possible to easily label each bar and color them differently, making it possible to create a legend immediately after calling the bar()/barh() method.
x = ["a", "b", "c"]
y = [10, 20, 15]

fig, ax = plt.subplots()
_ = ax.barh(x, y, labels=x)
ax.legend()
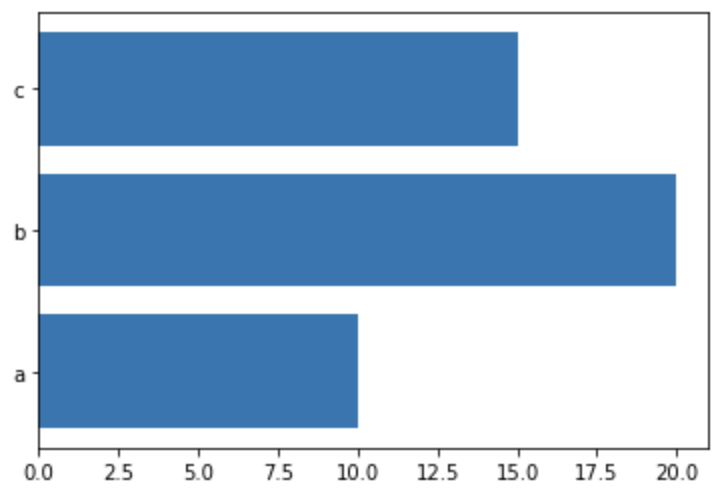
Default color behavior is preserved when labels isn't passed in:
x = ["a", "b", "c"]
y = [10, 20, 15]

fig, ax = plt.subplots()
_ = ax.barh(x, y)
PR Checklist
Tests and Styling
- [X] Has pytest style unit tests (and
pytestpasses). - [X] Is Flake 8 compliant (install
flake8-docstringsand runflake8 --docstring-convention=all).
Documentation
- [X] New features are documented, with examples if plot related.
- [X] New features have an entry in
doc/users/next_whats_new/(follow instructions in README.rst there). - [x] Documentation is sphinx and numpydoc compliant (the docs should build without error).
Thanks for the PR. First there is already a colors kwarg for bars, so how does this interact with that? Secondly there is tick_label kwarg that seems to be what this pr is suggesting? Can you clarify how this is different?
https://matplotlib.org/stable/api/_as_gen/matplotlib.pyplot.barh.html
This PR populates the label attribute on each of the bars in the bar container (i.e., to be able to call get_label() on the bar). The current behavior gives them all a label of _nolegend_:
>>> bar_container = ax.barh(x, y, label=x)
>>> print([bar.get_label() for bar in bar_container])
['_nolegend_', '_nolegend_', '_nolegend_']
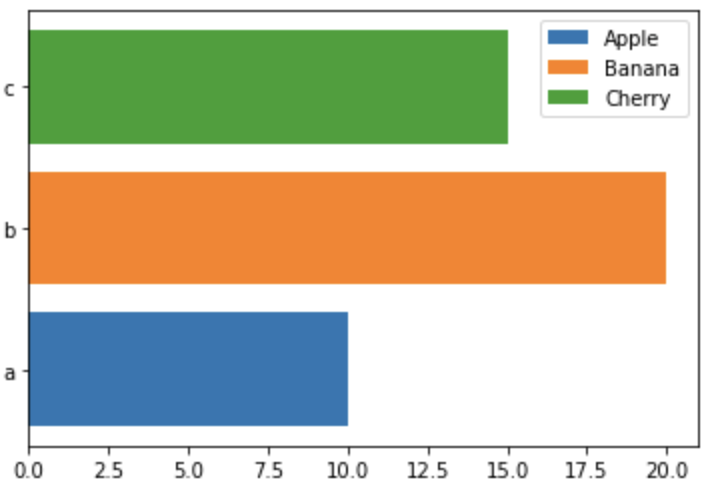
When color isn't provided, passing in labels will now cycle through the colors:
x = ["a", "b", "c"]
y = [10, 20, 15]

fig, ax = plt.subplots()
_ = ax.barh(x, y, labels=["Apple", "Banana", "Cherry"])
ax.legend()
When labels isn't provided, the colors behave exactly as they did before:
x = ["a", "b", "c"]
y = [10, 20, 15]

fig, ax = plt.subplots()
_ = ax.barh(x, y)
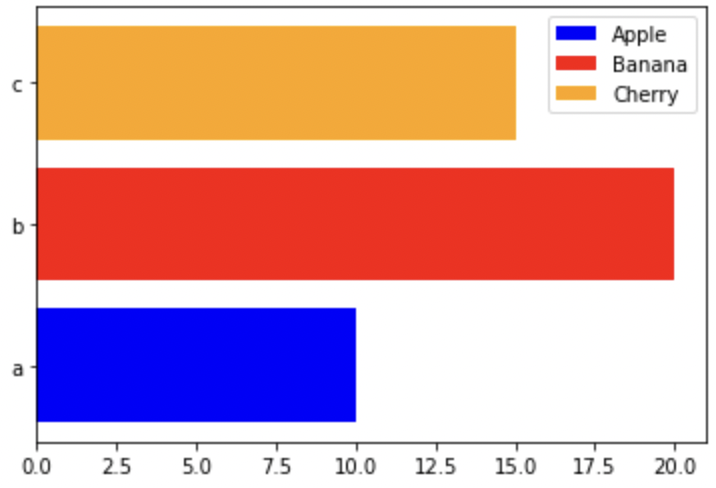
If you pass in both:
fig, ax = plt.subplots()
bar_container = ax.barh(x, y, labels=["Apple", "Banana", "Cherry"], color=['blue', 'red', 'orange'])
ax.legend()
Thanks I see. Do people want a legend if the bars are already labeled via the ticks?
My main use case was actually building animations. I use the get_label() to make sure I have the correct bar (e.g., this animation). The legend makes it easier to explain what is going on for the proposed changes.
I'm of two minds on this.
On one hand I see how much nicer this is that having to do the loop outside and I can totally see a use case for setting the legend and dropping the ticks / axis all together. I also see the analogy to stack plot (even if it is a bit rough because stackplots takes a sequence of sequences of scalars and bar only takes a sequence of scalars and a better analogy to stack plot would be extending bar to make stacked bar charts).
On the other hand I am worried about stacking yet more complexity into the public APIs!
I think in addition colors, labels will need to deconfilct with tick_labels (can you pass both? if you pass one is the other implied? do they have to match? do we need a way to ask for them to match?), the plain label (can you pass both labels and label? I can see arguments for both yes and no!), and the ax.bar_label method (which might need a way to ask the bars what their labels are now?).
Even if we do not take this, this is nice work. Thank you for a fully documented and tested PR out of the gate @stefmolin !
ignore the linting error #23527 will fix it.
I think in addition colors, labels will need to deconfilct with tick_labels (can you pass both? if you pass one is the other implied? do they have to match? do we need a way to ask for them to match?), the plain label (can you pass both labels and label? I can see arguments for both yes and no!) and the ax.bar_label method (which might need a way to ask the bars what their labels are now?).
Initially, I was trying to match the API of stackplot, but I definitely understand the concerns of making the API more complicated. For my use case, it would be perfectly acceptable for tick_labels to be used to label the bars.
My change to the bar colors was to make the legend in my examples make sense. So if we are more comfortable with just using the tick_labels already going on the axis to label the bars and not touching anything else, I'm happy to simplify the logic here :smile:
If we promote tick_label to also label the bars I think that would break cases like:
import matplotlib.pyplot as plt

x = [1, 2, 3]
y1 = [1, 5, 7]
y2 = [3, 1, 6]

fig, ax = plt.subplots()
ax.bar(x, y1, label='G1', tick_label=['a', 'b', 'c'])
ax.bar(x, y2, bottom=y1, label='G2', tick_label=['a', 'b', 'c'])
ax.legend()
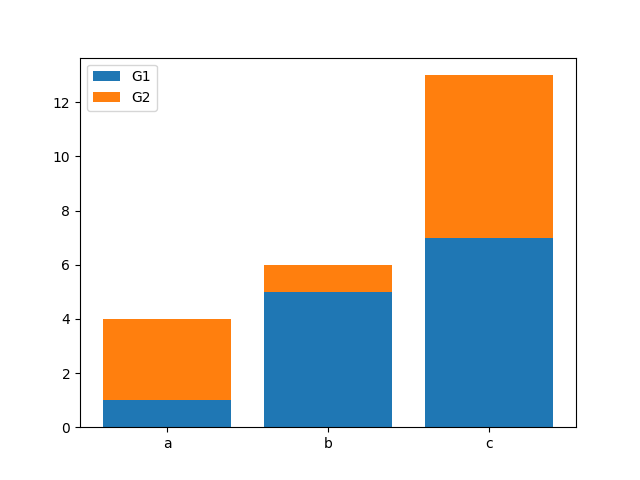
Maybe only do it if the overall bar does not have a label? Maybe make it opt-in like ax.bar(..., use_tick_label_as_bar_label=True) (but with a better name)?
Good point. Another option would be to prefix the individual bar labels with _nolegend_ and use namespacing like these for the blue ones in your example:
['_nolegend_:G1:a', '_nolegend_:G1:b', _nolegend_:G1:c']
so essentially naming everything in the case of stacked bars as _nolegend_:{label}:{tick_label}.
That way they don't show up in the legend, and at the same time, they have unique labels.
I feel that making bars indiviudally configurable was an overreach of the API of bar(), which we should not have done in the first place. That'd better been a seperate function.
But now that we are down the road, we can carefully expand - though I will not give a free-for-all ticket on individual customization.
The minimal (and possibly reasonable) extension is label supporting a list of labels (of matching length) that are assigned to the individual bars. Period.
I oppose auto-switching to color-cycling. bar() is primarily intended for same-style bars. Any bar-individual customiztation should be explicit.
I'm very sceptical on mixing with tick_labels. These are conecptually different things. Mixing them complicates things and I don't see a benefit. IMHO users rarely need tick_labels and a legend. And if they do, they can pass the list to both parameters.
Another option would be to prefix the individual bar labels with
_nolegend_and use namespacing
We guarantee that labels starting with an underscore are not drawn in the legend:
Specific lines can be excluded from the automatic legend element selection by defining a label starting with an underscore.
@stefmolin If your only conern is giving unique IDs to bars, you can define any label you want starting with an underscore for this. With the list-of-labels API suggested above, you can easily do that - and decide yourself how your IDs look like. I'm not clear if you propose the namespacing as a concept or automatism in matplotlib, but just to clarify, I don't think we want or need that complexity.
@timhoffm - That logic was if we were going to use the tick_labels to automatically label the bars. I agree that there is no need to impose any such logic on Matplotlib if we pass a list to label. I'll update my implementation to do just do that.
Here are some examples of the new implementation. Note that colors are no longer altered.
- Passing a list of labels:
>>> import matplotlib.pyplot as plt
>>>
>>> fig, ax = plt.subplots()
>>> bar_container = ax.barh(
...     ["a", "b", "c"],
...     [10, 20, 15],
...     label=["Apple", "Banana", "Cherry"]
... )
>>> [bar.get_label() for bar in bar_container]
['Apple', 'Banana', 'Cherry']
- Plotting a single bar
>>> import matplotlib.pyplot as plt
>>>
>>> fig, ax = plt.subplots()
>>> bar_container = ax.barh(
...     "a",
...     10,
...     label="Apple"
... )
>>> [bar.get_label() for bar in bar_container]
['Apple']
- Not passing in labels:
>>> import matplotlib.pyplot as plt
>>>
>>> fig, ax = plt.subplots()
>>> bar_container = ax.barh(
...     ["a", "b", "c"],
...     [10, 20, 15]
... )
>>> [bar.get_label() for bar in bar_container]
['_nolegend_', '_nolegend_', '_nolegend_']
- Plotting a stacked bar plot
>>> import matplotlib.pyplot as plt
>>> import itertools
>>>
>>> x = [1, 2, 3]
>>> y1 = [1, 5, 7]
>>> y2 = [3, 1, 6]
>>>
>>> fig, ax = plt.subplots()
>>> bar_container1 = ax.bar(
...     x, y1, label='G1', tick_label=['a', 'b', 'c']
... )
>>> bar_container2 = ax.bar(
...     x, y2, bottom=y1, label='G2', tick_label=['a', 'b', 'c']
... )
>>> [
...     bar.get_label()
...     for bar in itertools.chain(bar_container1, bar_container2)
... ]
['_nolegend_',
 '_nolegend_',
 '_nolegend_',
 '_nolegend_',
 '_nolegend_',
 '_nolegend_']
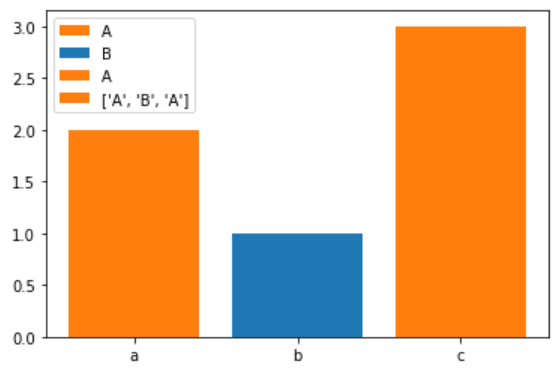
Definitely support this feature, but curious about the behavior where multiple bars that are styled the same way share a label? My bias is that a feature like this could/would be used in conjunction w/ tick labels to do some sort of grouping
fig, ax = plt.subplots()

x = ['a', 'b', 'c']
y = [2, 1, 3]
l = ['A', 'B', 'A']
c = ['tab:orange', 'tab:blue', 'tab:orange']

ax.bar(x, y, label=l, color=c)

ax.legend()
I tried to pull this branch and test against it, but I could be wrong, and this is what I got:
and I think the optimal behavior would be something like:

but I wonder about implementation complexity - I think it's something like check which bars have the same label and the same vectorized properties (color, edgecolor, linewidth) and then only label the first bar? Would there be a problem w/ making the duplicates no-legend?
The fourth element (['A', 'B', 'A']) in @story645's first plot is indeed a bug. label should be mapped either to the individual patches or to the BarContainer itself, but not both.
I advise against trying to automatically filter duplicates. That's tedious due to normalization. It's also a bit magical, as the entries legend entries are associated with the bars, if you filter duplicates out, technically some bars don't have a label, e.g. 'a' would be associtated with 'A' but 'c' wouldn't - it just looks the same. You could even break that by re-styling 'a' now. Then the legend would follow, but 'c' would not.
Instead, you could explicitly use ['A', 'B', '_nolegend_'], and then you know what is happening.
I advise against trying to automatically filter duplicates.
I won't block if labels are repeated in the legend, but I think then this choice has to be clearly documented as I expect it to be a follow up feature request.
Instead, you could explicitly use
['A', 'B', '_nolegend_'], and then you know what is happening.
I'd be ok w/ this being the example of how to use this keyword to do grouping, but I think it'd be worth either expanding one of the gallery examples or adding a new one discussing this.
Also, it seems like at least one image test wouldn't hurt.
think then this choice has to be clearly documented as I expect it to be a follow up feature request.
I'm fine with documenting that the behavior for repeated labels is not defined and may change in the future.
Also, it seems like at least one image test wouldn't hurt.
For now, the expected behavior is exactly defined by testing the labels of the individual bars and the label of the BarContainer: "Where does the information go?". Every Artistvwith a label shows up in the legend. There's no additional magic here that needs testing as an image.
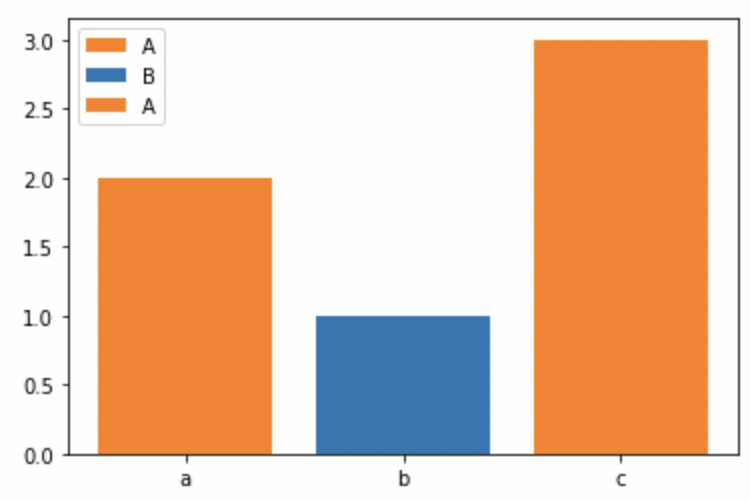
I addressed the comments and fixed that bug:
import matplotlib.pyplot as plt

fig, ax = plt.subplots()

x = ['a', 'b', 'c']
y = [2, 1, 3]
l = ['A', 'B', 'A']
c = ['tab:orange', 'tab:blue', 'tab:orange']

ax.bar(x, y, label=l, color=c)

ax.legend()
Instead, you could explicitly use ['A', 'B', '_nolegend_'], and then you know what is happening.
I'd be ok w/ this being the example of how to use this keyword to do grouping, but I think it'd be worth either expanding one of the gallery examples or adding a new one discussing this.
Can you provide some additional information on this?
There's no additional magic here that needs testing as an image.
Yeah I didn't quite grok how to test the double labeling issue, but I like @stefmolin adding it to the code tests better than an image test.
Can you provide some additional information on this?
I think this new keyword argument could be more discoverable with an addition to the gallery in the lines-bars-and-markers section showing 1) the use of this keyword 2) the use of this keyword with a mix of labels and no legend. The latter could also show off the list of colors, which is another keyword we don't have an explicit example for. Granted I can also spin thus request off into a follow up issue so this is another non-blocking request.
@stefmolin could you rebase this to squash out the adding / removed API change note?
@tacaswell - I rebased to remove those changes.
I also incorporated the change to the docstring as suggested. Linting is failing from the latest changes on master after the rebase.
I think this new keyword argument could be more discoverable with an addition to the gallery in the lines-bars-and-markers section showing 1) the use of this keyword 2) the use of this keyword with a mix of labels and no legend. The latter could also show off the list of colors, which is another keyword we don't have an explicit example for. Granted I can also spin thus request off into a follow up issue so this is another non-blocking request.
@story645 - Should I move forward with this in a separate PR?
@story645 - Should I move forward with this in a separate PR?
Yes, that would be awesome!
I squash-merged, as I don't think we need the history of no-longer-implemented functionality.