ipympl
 ipympl copied to clipboard
blitting doesn't work - would be useful to speed up graph draw for faster realtime-graphs
I have the following code in jupyterlab. This allows me to move a slider and update a graph in realtime. However the framerate is quite low (1fps) if I call fig.canvas.draw(). I therefore tried blitting, however it does not seem to affect the graph. Is this supposed to work with ipympl?
Many thanks for your help.
Environment: Jupyterlab==1.2.6 ipympl==0.5.6 jupyter labextension list:
@ibqn/jupyterlab-codecellbtn v0.1.3 enabled ok @jupyter-widgets/jupyterlab-manager v1.1.0 enabled ok @jupyterlab/google-drive v1.0.0 enabled ok @jupyterlab/toc v1.0.1 enabled ok jupyter-matplotlib v0.7.2 enabled ok jupyterlab-plotly v1.5.2 enabled ok plotlywidget v1.5.2 enabled ok
import pandas as pd, numpy as np
import time
import matplotlib.pyplot as plt

from ipywidgets import interact, interactive, fixed, interact_manual, Layout, VBox, HBox
import ipywidgets as widgets

from itertools import count
%matplotlib widget


blit = False # False works, True doesn't.

plt.close('all')
plt.ioff()

output = widgets.Output(layout={'width': '700px', 'height': '300px'})
fig, axs= plt.subplots(3, 2, figsize=(10, 8), sharex=True)
fig.canvas.header_visible = False
fig.canvas.toolbar_visible = False


for i in range(3):
    axs[i,0].set_ylim(-1.5,1.5)
    axs[i,0].set_xlim(0,20)

# index giver
x_value = count()

# expanding dataset
x, y = [], []

# initialise dummy data
[x.append(next(x_value)) for i in range(2)]
[y.append([1]*3) for i in range(2)]

# setup desired and actual angle plots
col_names = ['col1', 'col2', 'col3']
ax_df = pd.DataFrame(index=x,columns=col_names, data=y).plot(subplots=True, ax=axs[:,0])

if blit:
    bgs = []
    for ax in ax_df:
        # cache the background
        ax_background = fig.canvas.copy_from_bbox(ax.bbox)
        bgs.append(ax_background)

    fig.canvas.draw()  # initial draw required

# monitor framerate
t_start = time.time()

# event handler
def on_value_changed(change):
    with output:
        next_x = next(x_value) # generate next x axis value
        x.append(next_x)
        y.append([change.new]*3)

        for i in range(3):
            if blit:
                # update data
                line = ax_df[i].get_lines()[0]
                line.set_data(x, pd.DataFrame(y).iloc[:,i])

                # restore background
                fig.canvas.restore_region(bgs[i])

                # redraw just the points
                ax_df[i].draw_artist(line)

                # fill in the axes rectangle
                fig.canvas.blit(ax_df[i].bbox)

            else:
                # update data
                ax_df[i].get_lines()[0].set_data(x, pd.DataFrame(y).iloc[:,i])

                # rescale view
                ax_df[i].autoscale_view(None,'x',None)
                ax_df[i].relim()

        fig.canvas.flush_events()

        if not blit:
            fig.canvas.draw() # this slows down framerate, not required for blit

        print(f"FPS: {round(next_x/(time.time() - t_start),2)}", end=", ")

sliders = []
int_slider = widgets.FloatSlider(description="test",
                                 min=-1, max=1,
                                 value = 0, continuous_update=True,
                                 orientation="horizontal",
                                 layout=widgets.Layout(width="500px", height="20px"))
int_slider.observe(on_value_changed, names="value")
sliders = widgets.VBox([int_slider, fig.canvas, output])
display(sliders)
The issue seems to be related to send_binary method of Canvas class in ipympl. It does not send any blob's back when blitting and plt.ioff(), but does when drawing (it then sends the full graph). However, when blitting, and setting plt.ion(), it does send back something, but it is just the graph line on transparent background. The graph line looks somewhat broken (not solid):
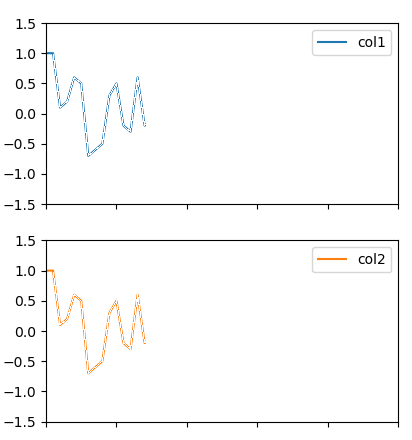
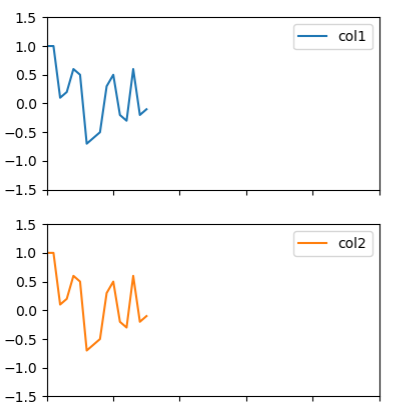
I also noticed that as soon as I resize the graph, the line suddenly becomes solid (assuming it resends the full graph):
I'd try using fig.canvas.draw_idle - I found that that was sometimes helpful.
Thanks - I tried replacing fig.canvas.draw() with fig.canvas.draw_idle() but could not see any noticeable improvement in framerate.
indeed. I've since learned that for this backend draw_idle just calls draw so I was apparently fooling myself with the placebo effect before.
Since ipympl inherits most of it's functionality from the WebAgg backend from core matplotlib I suspect that the path getting working blitting is for this PR to be moved forward: https://github.com/matplotlib/matplotlib/pull/9240
(though I could be totally wrong about that)
workign on adding blitting in https://github.com/matplotlib/matplotlib/pull/19059
@kaiaeberli those changes will be included in matplotlib version 3.4 which I think is being released ~~ sometime ~~ in the next month or two.
Note that this is not full blitting like in the qt backend as discussed here: https://github.com/matplotlib/matplotlib/pull/19059#discussion_r535407110 however there is still a significant performance improvement possible.
@ianhi hi, those changes are merged but it seems blit is still not supported by ipympl backend's Figures (fig.canvas.supports_blit is still False). Do you happen to have a quick way to fix this?
Hi @meakbiyik the current situtation is the in MPL 3.4+ the methods for blitting exist but supports_blit is False due to https://github.com/matplotlib/matplotlib/pull/19762 which was put in to prevent issues that blitting was introducing with some of the matplotlib widgets: https://github.com/matplotlib/matplotlib/issues/19701
I believe that this means you can use blitting manually as much as you want, but passing useblit=True to things like multicursor will not actually result in blitting.