turing-smart-screen-python
 turing-smart-screen-python copied to clipboard
Unable to display AMD GPU Stats on Windows
Describe the bug
AMD GPU load stats missing
To Reproduce
Steps to reproduce the behavior:
Launch the application.
Expected behavior
GPU load to be displayed.
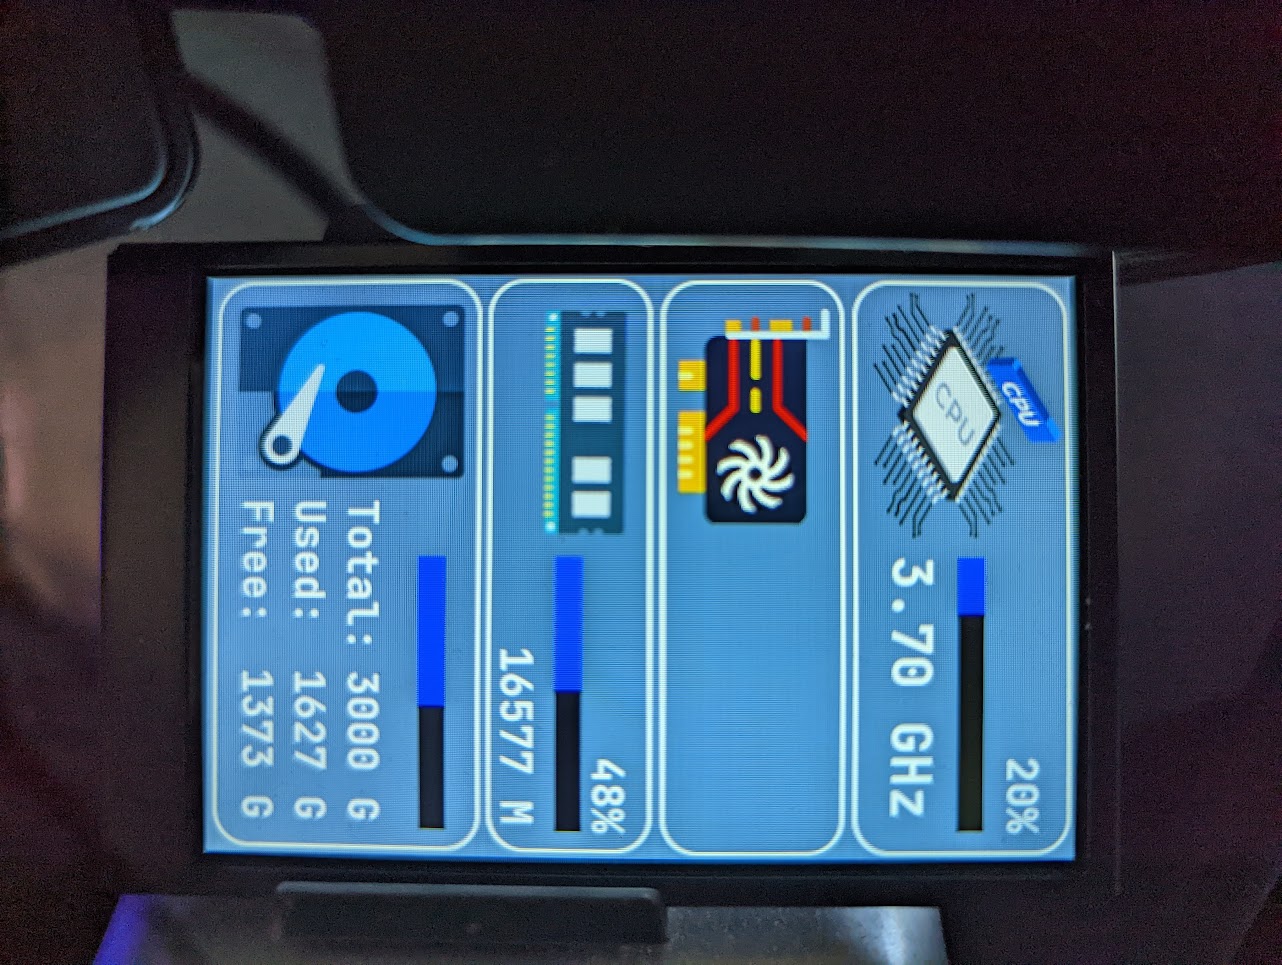
Screenshots / photos of the Turing screen
Environment:
- Release or branch of this project
- 2.0.3
- OS with version
- Windows 11
- Python version [e.g. Python 3.8, to get it run
python3 --version]- 3.10.6
- Hardware [e.g. Intel CPU, Nvidia GPU, Raspberry Pi 3 B+ ...]
- AMD 9 5900X
- ASUS Crosshair VI Hero WiFi
- AMD RX 5700 XT (Gigabyte)
Additional context
PS E:\>
PS E:\> cd '.\Turing Display\'
PS E:\Turing Display> cd .\turing-smart-screen-python-2.0.3\
PS E:\Turing Display\turing-smart-screen-python-2.0.3>
PS E:\Turing Display\turing-smart-screen-python-2.0.3>
PS E:\Turing Display\turing-smart-screen-python-2.0.3> python .\main.py
09:13:45 [INFO] Loading theme 3.5inchTheme2 from res/themes/3.5inchTheme2/theme.yaml
09:13:45 [DEBUG] Auto detected COM port: COM4
09:13:45 [INFO] Display reset (COM port may change)...
09:13:46 [DEBUG] Auto detected COM port: COM4
09:13:46 [INFO] HW revision A does not support backplate LED color setting
09:13:46 [DEBUG] Drawing Image: BACKGROUND
09:13:46 [DEBUG] Drawing Text: DISK_USED_LABEL
09:13:46 [DEBUG] Drawing Text: DISK_FREE_LABEL
09:13:46 [DEBUG] Drawing Text: DISK_TOTAL_LABEL
09:13:46 [WARNING] Your CPU temperature is not supported yet
09:13:46 [WARNING] Your GPU memory size/usage stats are not supported yet
09:13:46 [INFO] Detected AMD GPU(s)
Exception in thread GPU_Stats:
Traceback (most recent call last):
  File "C:\Users\Nealio\AppData\Local\Programs\Python\Python310\lib\threading.py", line 1016, in _bootstrap_inner
    self.run()
  File "C:\Users\Nealio\AppData\Local\Programs\Python\Python310\lib\threading.py", line 953, in run
    self._target(*self._args, **self._kwargs)
  File "E:\Turing Display\turing-smart-screen-python-2.0.3\library\scheduler.py", line 56, in wrap
    periodic(scheduler, interval, func)
  File "E:\Turing Display\turing-smart-screen-python-2.0.3\library\scheduler.py", line 47, in periodic
    action(*actionargs)
  File "E:\Turing Display\turing-smart-screen-python-2.0.3\library\scheduler.py", line 109, in GpuAmdStats
    stats.GpuAmd.stats()
  File "E:\Turing Display\turing-smart-screen-python-2.0.3\library\stats.py", line 339, in stats
    load_all = [item.getCurrentUsage() for item in amd_gpus]
  File "E:\Turing Display\turing-smart-screen-python-2.0.3\library\stats.py", line 339, in <listcomp>
    load_all = [item.getCurrentUsage() for item in amd_gpus]
  File "C:\Users\Nealio\AppData\Local\Programs\Python\Python310\lib\site-packages\pyadl\pyadl.py", line 293, in getCurrentUsage
    return ADLManager.getInstance().getCurrentUsage(self)
  File "C:\Users\Nealio\AppData\Local\Programs\Python\Python310\lib\site-packages\pyadl\pyadl.py", line 182, in getCurrentUsage
    raise ADLError("Failed to get CurrentUsage")
pyadl.pyadl.ADLError: Failed to get CurrentUsage
Hi, thanks for raising this issue It seems your GPU stats cannot be read by the pyadl library, at least for the usage, we don't know about the rest because it crashes.
Can you tell me if you use the AMD proprietary driver (the one that comes with the AMD Software: Adrenalin Edition) and the version installed? You can use this link https://www.amd.com/en/support/kb/faq/dh-016 or this one https://www.amd.com/en/support/kb/faq/dh2-016 to get your driver version
Another test to help me debug is to download https://github.com/nicolargo/pyadl sources and run their test program python.exe .\test.py -s
you should have an output like this:
PS C:\Users\user\workspace\pyadl> python.exe .\test.py -s
0. b'Radeon RX 580 Series'
        Engine core voltage: 1093 mV (0.0 mV - 0.0 mV)
        Engine clock: 1300.0 MHz (150.0 MHz - 2000.0 MHz)
        Memory clock: 2000.0 MHz (150.0 MHz - 2250.0 MHz)
        Fan speed: 0 % (0 % - 100 %)
        Fan speed: 0 RPM (0 RPM - 3200 RPM)
        Temperature: 48.0 Celsius
        Usage: 0 %
Thanks
AMD Driver 22.8.2
PYADL Test results:
PS E:\Turing Display\pyadl-master> python .\test.py -s
0. b'AMD Radeon RX 5700 XT'
Failed to get EngineClockRange
This is what i feared. It seems the pyadl library does not support reading your GPU stats. It is surely because this library last change was done in 2017, whereas your GPU has been released in Q2 2019, so the interface of the AMD .dll to read newer GPU stats must be different.
I will try to find a newer library, maybe someone made a fork and updated it. I will also add some try/except in the Python code to avoid ugly Traceback when GPU is unsupported
Hi @Nealtron A new beta release has been created with the support of LibreHardwareMonitor for sensors. It should add support for newer (2019+) AMD GPU. https://github.com/mathoudebine/turing-smart-screen-python/releases/tag/2.2.0-beta.1 If you have time to test it, i would love your feedback!
Load % and temperature appear to be functional now! Haven't compared them to otherwise trusted statistics yet, but the values are changing.
I am receiving the following error in the console:
[WARNING] Your GPU memory absolute usage (M) is not supported yet
Hi @Nealtron
Thanks for testing this alpha release.
The 2.2.0 final release has now been created.
For the [WARNING] Your GPU memory absolute usage (M) is not supported yet unfortunately the AMD GPUs does not offer an public API to get the current memory usage. It is a hardware limitation.