logseq
 logseq copied to clipboard
Occasional high CPU usage in background on MacBook
What happened?

Sometimes Logseq will suddenly start to use a lot of CPU in the background, unless I force-quit. This doesn't happen when I'm using the app or force a re-index. Only when the app is in the background (but only rarely - not every day - I get alerts if an app is doing this).
Reproduce the Bug
Logeq is open in background.
Expected Behavior
No response
Screenshots
No response
Desktop Platform Information
MacOS 12.3.1
Mobile Platform Information
No response
Additional Context
No response

This is on version 0.6.7. Again, it is running in the background. The only thing I can think that I was doing this time copying some files to Google Drive, but this was a finder operation that had nothing to do with iCloud or Logseq. I had to force quit Logseq and reload it.
I have same similar problems , logseq still running high cpu usages in the background.
Hadn't noticed this in a while, but it just happened again. I'm using version 0.7.6. Restarting Logseq fixes the problem (but I have to force-quit first).
I constantly get high CPU usage when the app is in the background... I thought everyone get used to it already.

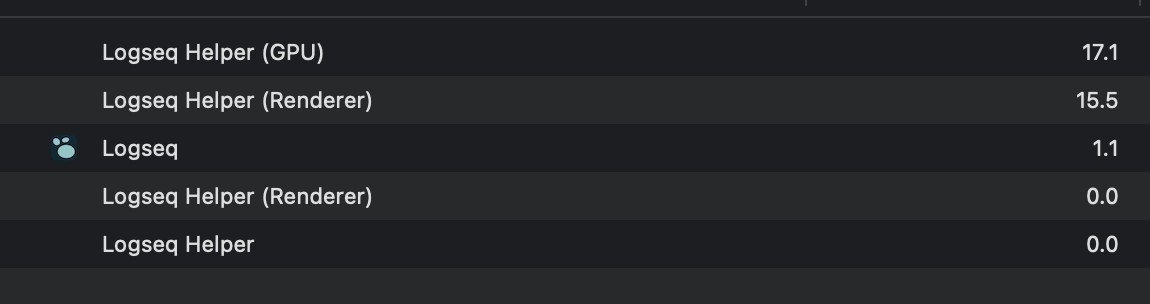
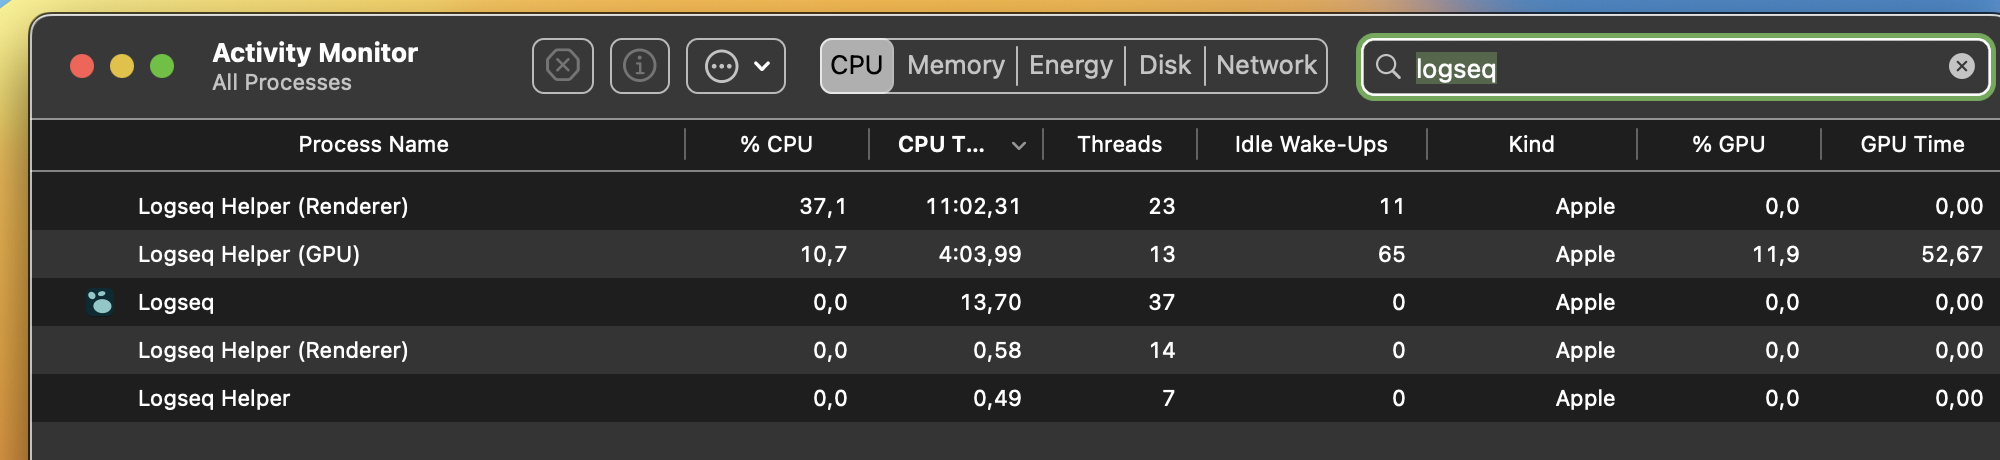
I noticed high CPU/GPU usage by Logseq. Quit the application. Started it up again and immediatedly and constantly it hovers around 29% CPU usage by Logseq Helper (Renderer) and 19% CPU and 26% GPU usage by Logseq Helper (GPU). See screenshot.
This is with the Logseq Desktop app 0.8.7 on a MacBook Pro (16-inch, 2021) with an Apple M1 Max processor running MacOS macOS 12.6
The same, if not worse, with Logseq version 0.8.8:

This is with Logseq simply running in the background.
Also have this issue. Logseq Version 0.8.10 and previous versions. Mac os 13.0 (22A380)
I'm experiencing this as well. The process "Logseq Helper (Renderer)" is constantly using 80% CPU, and the process "Logseq Helper (GPU)" constantly using 50% CPU, even though the app is idle in the background. I'm using macOS Monterey 12.5 on a M1 Macbook, Logseq version is 0.8.15.
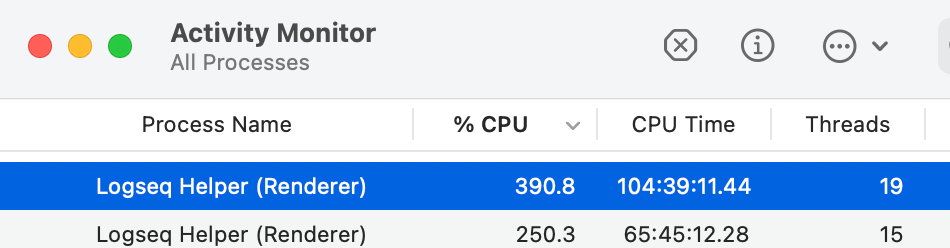
I observed 390% + 250% usage while it's idle in the background, which makes my MacBook hot... (v0.8.17)
FWIW, I found plenty of "High CPU Usage" issues in electron 😅 https://github.com/electron/electron/issues?q=High+CPU+Usage
Does anyone know why this is happening? What is it doing in the background?
@eastack @Ruco Seems like an upstream issue of Electron according to the finding of xxchan. Or you may record a performance profile so we can do some check: https://help.figma.com/hc/en-us/articles/360041468414-Record-a-Chrome-Performance-Profile
well indeed there are multiple reports in Electron repo about high CPU usage, however only 1 of them is open and it doesn't seem to be related to the case here.
I have quite a few other Electron apps that I'm using on a daily basis and they appear to be ok in terms of CPU usage, so perhaps it is too early to label this as an upstream/electron issue.
@cnrpman
@Meowzz95 Another guess would be the installer issue. We are looking for performance profile on cpu usage happens, and also looking for clarifications on whether it's happening after a fresh installing / auto upgrading
Also I wonder if re-installing help: https://github.com/logseq/logseq/issues/4234
Update. I seem to be able to resolve this, have tested on two machines now by following these steps: Uninstalling via Add / Remove Programs in Windows Deleting contents of C:\Users<User>\AppData\Local\Logseq\ (As this exists after uninstall) Rebooting (this seems necessary - installing right after uninstalling doesn't resolve) Reinstall (v0.5.9) I don't know enough about the installer to suggest why this might be. Leaving the issue open in case it's useful to devs.
It's worth acknowledging that this ticket is crossing a big temporal gap. Not expecting every case is caused by the same issue. There could be variety of unique problems that may arise.
Or you may record a performance profile so we can do some check: help.figma.com/hc/en-us/articles/360041468414-Record-a-Chrome-Performance-Profile
Such instructions about how to help provide more diagnostic info help a lot :p
Will try next time.
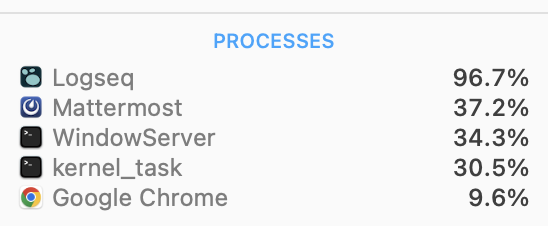
@cnrpman Happened yesterday after I did the upgrade. I forced stopped it in the activity monitor and my CPU usage is back to normal today. I've for sure noticed the Logseq Helper (Renderer) at the top of my CPU usage before, but it must not have been enough to impact my mac's performance. Yesterday, my CPU usage was at 96%.
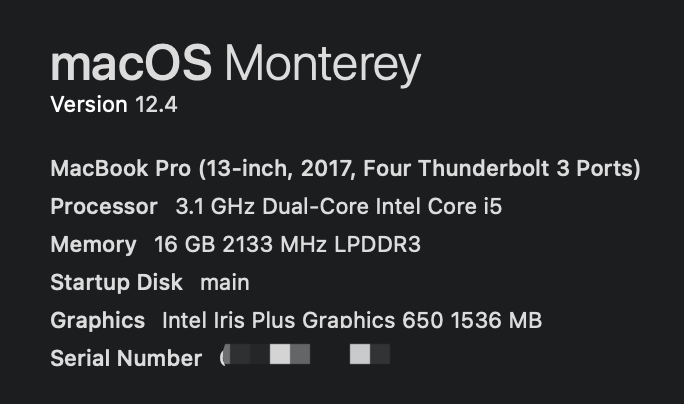
With 0.9.10 on Mac High Sierra get the following Activity Monitor Readings when I'm in Logseq but not doing anything
I still get high CPU usage just after working for a while on the same page. I usually fix it by relaunching the app, but there is definitely something wrong with performance that needs to be fixed. (Sorry I can't be more specific.)
Or you may record a performance profile so we can do some check: help.figma.com/hc/en-us/articles/360041468414-Record-a-Chrome-Performance-Profile
Please try to provide more information according to this instruction above.
The problem is that it usually happens when I am doing a lot of work, and so I don't have the time at that moment to produce a report... but I'll try if it happens again when I have the time.