FastChat
 FastChat copied to clipboard
Unable to save the mode weights - GPU OOM
I am finetuning vicuna using 4 * A100-80G GPUs. I meet some problem after finish training,
{'loss': 1.3641, 'learning_rate': 4.815273327803183e-08, 'epoch': 0.97}
{'loss': 1.35, 'learning_rate': 2.7095433213097933e-08, 'epoch': 0.97}
{'loss': 1.3491, 'learning_rate': 1.2045437948275952e-08, 'epoch': 0.98}
{'loss': 1.3324, 'learning_rate': 3.0118130379575005e-09, 'epoch': 0.99}
{'loss': 1.317, 'learning_rate': 0.0, 'epoch': 1.0}
{'train_runtime': 601.9411, 'train_samples_per_second': 7.029, 'train_steps_per_second': 0.219, 'train_loss': 1.4777254832513405, 'epoch': 1.0}

....
ayers.39.mlp.gate_proj.weight on rank 1. This may mean that this state_dict entry could point to invalid memory regions after returning from state_dict() call if this parameter is managed by FSDP. Please check clone implementation of _fsdp_wrapped_module.model.layers.39.mlp.gate_proj.weight. Error: CUDA out of memory. Tried to allocate 270.00 MiB (GPU 1; 79.35 GiB total capacity; 76.93 GiB already allocated; 72.19 MiB free; 77.38 GiB reserved in total by PyTorch) If reserved memory is >> allocated memory try setting max_split_size_mb to avoid fragmentation.  See documentation for Memory Management and PYTORCH_CUDA_ALLOC_CONF
/usr/local/lib/python3.10/site-packages/torch/distributed/fsdp/_state_dict_utils.py:312: UserWarning: Failed to clone() tensor with name lm_head.weight on rank 1. This may mean that this state_dict entry could point to invalid memory regions after returning from state_dict() call if this parameter is managed by FSDP. Please check clone implementation of lm_head.weight. Error: CUDA out of memory. Tried to allocate 626.00 MiB (GPU 1; 79.35 GiB total capacity; 76.26 GiB already allocated; 50.19 MiB free; 77.41 GiB reserved in total by PyTorch) If reserved memory is >> allocated memory try setting max_split_size_mb to avoid fragmentation.  See documentation for Memory Management and PYTORCH_CUDA_ALLOC_CONF
  warnings.warn(
Traceback (most recent call last):
  File "/tmp/FastChat/fastchat/train/train_mem.py", line 12, in <module>
    train()
  File "/usr/local/lib/python3.10/site-packages/fastchat/train/train.py", line 335, in train
    safe_save_model_for_hf_trainer(trainer=trainer,
  File "/usr/local/lib/python3.10/site-packages/fastchat/train/train.py", line 70, in safe_save_model_for_hf_trainer
    cpu_state_dict = {
  File "/usr/local/lib/python3.10/site-packages/fastchat/train/train.py", line 71, in <dictcomp>
    key: value.cpu()
RuntimeError: CUDA error: invalid argument
CUDA kernel errors might be asynchronously reported at some other API call, so the stacktrace below might be incorrect.
For debugging consider passing CUDA_LAUNCH_BLOCKING=1.
Compile with `TORCH_USE_CUDA_DSA` to enable device-side assertions.

ERROR:torch.distributed.elastic.multiprocessing.api:failed (exitcode: 1) local_rank: 0 (pid: 2871) of binary: /usr/local/bin/python3
Traceback (most recent call last):
  File "/usr/local/bin/torchrun", line 8, in <module>
    sys.exit(main())
  File "/usr/local/lib/python3.10/site-packages/torch/distributed/elastic/multiprocessing/errors/__init__.py", line 346, in wrapper
    return f(*args, **kwargs)
  File "/usr/local/lib/python3.10/site-packages/torch/distributed/run.py", line 794, in main
    run(args)
  File "/usr/local/lib/python3.10/site-packages/torch/distributed/run.py", line 785, in run
    elastic_launch(
  File "/usr/local/lib/python3.10/site-packages/torch/distributed/launcher/api.py", line 134, in __call__
    return launch_agent(self._config, self._entrypoint, list(args))
  File "/usr/local/lib/python3.10/site-packages/torch/distributed/launcher/api.py", line 250, in launch_agent
    raise ChildFailedError(
torch.distributed.elastic.multiprocessing.errors.ChildFailedError:
============================================================
/tmp/fschat/fastchat/train/train_mem.py FAILED
------------------------------------------------------------
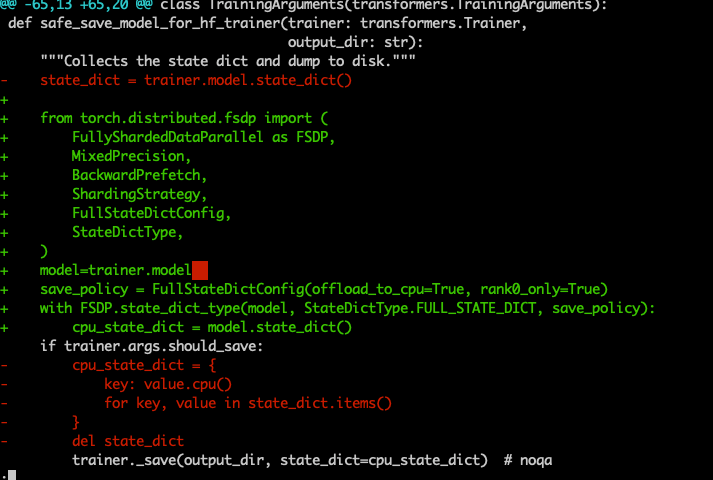
Seems there're some problems here. https://github.com/lm-sys/FastChat/blob/e2de15f23ea4ef159669422043516a708dad28e3/fastchat/train/train.py#L65-L75
I change to below now and there's no OOM but persistent never ends.
training scripts
torchrun --nnodes=1 --nproc_per_node=4 --master_port=3121 \
    /tmp/FastChat/fastchat/train/train_mem.py \
    --model_name_or_path $MODEL_WEIGHTS_PATH \
    --data_path $DATA_PATH \
    --bf16 True \
    --output_dir $CHECKPOINT_PATH \
    --num_train_epochs 1 \
    --per_device_train_batch_size 4 \
    --per_device_eval_batch_size 4 \
    --gradient_accumulation_steps 2 \
    --evaluation_strategy "no" \
    --save_strategy "steps" \
    --save_steps 1200 \
    --save_total_limit 10 \
    --learning_rate 2e-5 \
    --weight_decay 0. \
    --warmup_ratio 0.03 \
    --lr_scheduler_type "cosine" \
    --logging_steps 1 \
    --fsdp "full_shard auto_wrap" \
    --fsdp_transformer_layer_cls_to_wrap 'LlamaDecoderLayer' \
    --tf32 True \
    --model_max_length 2048 \
    --gradient_checkpointing True \
    --lazy_preprocess True
Just a comment it eventually times out. @zhisbug A quick question, how did vicuna workaround this issue in the past and successfully save the weights?
100%|████████████████████████████████████████████████████████████████████████████████████████████████████████████████████████████████████████████████████████████████████| 9/9 [01:54<00:00, 12.76s/it]
[E ProcessGroupNCCL.cpp:828] [Rank 0] Watchdog caught collective operation timeout: WorkNCCL(SeqNum=2778, OpType=_ALLGATHER_BASE, Timeout(ms)=1800000) ran for 1801649 milliseconds before timing out.
[E ProcessGroupNCCL.cpp:455] Some NCCL operations have failed or timed out. Due to the asynchronous nature of CUDA kernels, subsequent GPU operations might run on corrupted/incomplete data.
[E ProcessGroupNCCL.cpp:460] To avoid data inconsistency, we are taking the entire process down.
terminate called after throwing an instance of 'std::runtime_error'
  what():  [Rank 0] Watchdog caught collective operation timeout: WorkNCCL(SeqNum=2778, OpType=_ALLGATHER_BASE, Timeout(ms)=1800000) ran for 1801649 milliseconds before timing out.
ERROR:torch.distributed.elastic.multiprocessing.api:failed (exitcode: -6) local_rank: 0 (pid: 5037) of binary: /usr/bin/python
Traceback (most recent call last):
  File "/usr/local/bin/torchrun", line 8, in <module>
    sys.exit(main())
  File "/usr/local/lib/python3.10/dist-packages/torch/distributed/elastic/multiprocessing/errors/__init__.py", line 346, in wrapper
    return f(*args, **kwargs)
  File "/usr/local/lib/python3.10/dist-packages/torch/distributed/run.py", line 794, in main
    run(args)
  File "/usr/local/lib/python3.10/dist-packages/torch/distributed/run.py", line 785, in run
    elastic_launch(
  File "/usr/local/lib/python3.10/dist-packages/torch/distributed/launcher/api.py", line 134, in __call__
    return launch_agent(self._config, self._entrypoint, list(args))
  File "/usr/local/lib/python3.10/dist-packages/torch/distributed/launcher/api.py", line 250, in launch_agent
    raise ChildFailedError(
torch.distributed.elastic.multiprocessing.errors.ChildFailedError:
=====================================================
/tmp/FastChat/fastchat/train/train_mem.py FAILED
-----------------------------------------------------
Failures:
  <NO_OTHER_FAILURES>
-----------------------------------------------------
Root Cause (first observed failure):
[0]:
  time      : 2023-04-07_07:00:37
  host      : edf307caae46
  rank      : 0 (local_rank: 0)
  exitcode  : -6 (pid: 5037)
  error_file: <N/A>
  traceback : Signal 6 (SIGABRT) received by PID 5037
=====================================================
This is a very deep system bug in FSDP. We'll try to address it by this weekend, but @Jeffwan if you have a tight schedule to train 13B, I'd recommend you simply use 80GB A100.
Hi, I tried running the 13B model on A100 40GB GPU. The responses initially are good but then, after a while i get hit with CUDA out of memory error.
To be noted, I am trying to infer the responses and not train here.
I think this might be related somewhere. Will post my other observations as well
@zhisbug, thank you for your input. I'm also running into the same issue. I'm training on 8A100s-80GB. Can we maybe shift to deepspeed in the meantime? I'm just not sure about this flag --fsdp_transformer_layer_cls_to_wrap 'LlamaDecoderLayer'.
Also, I had 13B checkpoint saved at some point (don't know how) but could not load it. It resulted in the following error Unable to load weights from pytorch checkpoint file ... If you tried to load a PyTorch model from a TF 2.0 checkpoint, please set from_tf=True. This maybe suggests that the checkpoint is corrupted.
https://github.com/tatsu-lab/stanford_alpaca/issues/81 I think it is the same as the above issue and the solution there should work here as well.
Thank you very much @ZYHowell! I applied the fix they mention and trained for few iterations. I was able to save and load the checkpoint of 13B model.
@HaniItani ,Hello, I have the same error which means the checkpoint is corrupted. How do you solve it?
This is a very deep system bug in FSDP. We'll try to address it by this weekend, but @Jeffwan if you have a tight schedule to train 13B, I'd recommend you simply use 80GB A100.
I would like to ask a question about encountering OOM when saving parameters after model training. I saw someone recommending to turn on cpu_offload for state_dict. I'm not sure how to modify it. Could you please provide the code for the modification?
@Jeffwan hey, have you managed to do so? It's been a bit already.
By the way, this is a FSDP bug, right? We should close the issue here and check it on their repo, what do you think?