prometheus-adapter
 prometheus-adapter copied to clipboard
Empty custom metrics
Hi, I've installed prometehus adapter with the following command:
helm install prometheus-adapter stable/prometheus-adapter -n monitoring -f values.yaml
value.yaml as follows:
# Default values for k8s-prometheus-adapter..
affinity: {}

image:
  repository: directxman12/k8s-prometheus-adapter-amd64
  tag: v0.7.0
  pullPolicy: IfNotPresent

logLevel: 10

metricsRelistInterval: 1m

listenPort: 6443

nodeSelector: {}

priorityClassName: ""

# Url to access prometheus
prometheus:
  url: http://prometheus-k8s.monitoring.svc
  port: 9090
  path: ""

replicas: 1

rbac:
  # Specifies whether RBAC resources should be created
  create: true

serviceAccount:
  # Specifies whether a service account should be created
  create: true
  # The name of the service account to use.
  # If not set and create is true, a name is generated using the fullname template
  name:

resources:
   requests:
     cpu: 100m
     memory: 128Mi
   limits:
     cpu: 300m
     memory: 512Mi

rules:
  default: false
  custom:
  - seriesQuery: 'nginx_vts_server_requests_total'
    resources:
      overrides:
        kubernetes_namespace:
          resource: namespace
        kubernetes_pod_name:
          resource: pod
    name:
      matches: "^(.*)_total"
      as: "${1}_per_second"
    metricsQuery: (sum(rate(<<.Series>>{<<.LabelMatchers>>}[1m])) by (<<.GroupBy>>))
  - seriesQuery: 'http_server_requests_seconds_count'
    resources:
      overrides:
        kubernetes_namespace:
          resource: namespace
        kubernetes_pod_name:
          resource: pod
    name:
      matches: "^(.*)_count"
      as: "${1}_java_count"
    metricsQuery: (sum(rate(<<.Series>>{<<.LabelMatchers>>}[1m])) by (<<.GroupBy>>))

  existing:
  external: []
  resource: {}
service:
  annotations: {}
  port: 443
  type: ClusterIP

tls:
  enable: false
  ca: |-
    # Public CA file that signed the APIService
  key: |-
    # Private key of the APIService
  certificate: |-
    # Public key of the APIService

extraVolumes: []
extraVolumeMounts: []
tolerations: []
podLabels: {}
podAnnotations: {}
hostNetwork:
  enabled: false
However when checking with kubectl get --raw /apis/custom.metrics.k8s.io/v1beta1, I dont see any metrics being registered.
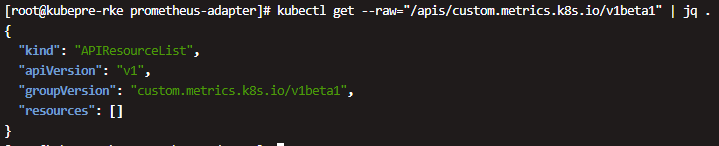
But the same configuration is available in my new K8S cluster. Please help me.
k8s apiserver log
[root@kubepre-master-01 ~]# docker logs -f kube-apiserver --tail=20
I0511 06:28:55.319202       1 controller.go:127] OpenAPI AggregationController: action for item v1beta1.custom.metrics.k8s.io: Rate Limited Requeue.
E0511 06:30:55.320877       1 controller.go:114] loading OpenAPI spec for "v1beta1.custom.metrics.k8s.io" failed with: OpenAPI spec does not exist
k8s version. Install in RKE
[root@kubepre-rke kube-PsFMBSd2o4]# kubectl version
Client Version: version.Info{Major:"1", Minor:"18", GitVersion:"v1.18.2", GitCommit:"52c56ce7a8272c798dbc29846288d7cd9fbae032", GitTreeState:"clean", BuildDate:"2020-04-16T11:56:40Z", GoVersion:"go1.13.9", Compiler:"gc", Platform:"linux/amd64"}
Server Version: version.Info{Major:"1", Minor:"18", GitVersion:"v1.18.6", GitCommit:"dff82dc0de47299ab66c83c626e08b245ab19037", GitTreeState:"clean", BuildDate:"2020-07-15T16:51:04Z", GoVersion:"go1.13.9", Compiler:"gc", Platform:"linux/amd64"}
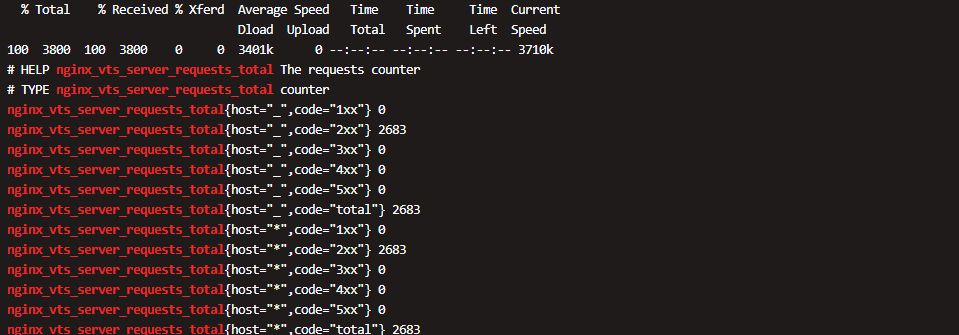
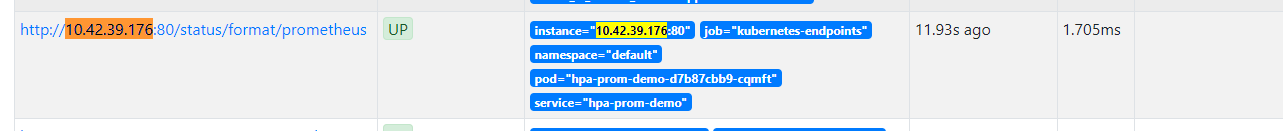
Obtaining data from Prometheus is normal
GET http://prometheus-k8s.monitoring.svc:9090/api/v1/series?match%5B%5D=nginx_vts_server_requests_total&start=1652248066.351 200 OK
I deployed the nginx service as a test,
the adapter log level is --v=10 The following content appears in the log, but no other error logs have been found yet
metric pods/nginx_vts_server_requests_per_second(namespaced) not registered
https://github.com/kubernetes-sigs/prometheus-adapter/issues/393#issuecomment-920987647 helped for me.
In my case, metric query worked but adapter seemed to have some hard time converting that to api output.
same problem
  custom:
    - seriesQuery: '{__name__=~"^sky_users.*"}'
      resources:
        overrides:
          namespace: { resource: "namespace" }
          pod: { resource: "pod" }
      name:
        matches: ".*"
        as: "sky_users"
      metricsQuery: 'avg(sky_mod_users) by (namespace)'
kubectl get --raw "/apis/custom.metrics.k8s.io/v1beta1/namespaces/sky/pods/*/sky_users"
{"kind":"MetricValueList","apiVersion":"custom.metrics.k8s.io/v1beta1","metadata":{"selfLink":"/apis/custom.metrics.k8s.io/v1beta1/namespaces/sky/pods/%2A/sky_users"},"items":[]}
The Kubernetes project currently lacks enough contributors to adequately respond to all issues and PRs.
This bot triages issues and PRs according to the following rules:
- After 90d of inactivity,
lifecycle/staleis applied - After 30d of inactivity since
lifecycle/stalewas applied,lifecycle/rottenis applied - After 30d of inactivity since
lifecycle/rottenwas applied, the issue is closed
You can:
- Mark this issue or PR as fresh with
/remove-lifecycle stale - Mark this issue or PR as rotten with
/lifecycle rotten - Close this issue or PR with
/close - Offer to help out with Issue Triage
Please send feedback to sig-contributor-experience at kubernetes/community.
/lifecycle stale
The Kubernetes project currently lacks enough active contributors to adequately respond to all issues and PRs.
This bot triages issues and PRs according to the following rules:
- After 90d of inactivity,
lifecycle/staleis applied - After 30d of inactivity since
lifecycle/stalewas applied,lifecycle/rottenis applied - After 30d of inactivity since
lifecycle/rottenwas applied, the issue is closed
You can:
- Mark this issue or PR as fresh with
/remove-lifecycle rotten - Close this issue or PR with
/close - Offer to help out with Issue Triage
Please send feedback to sig-contributor-experience at kubernetes/community.
/lifecycle rotten
The Kubernetes project currently lacks enough active contributors to adequately respond to all issues and PRs.
This bot triages issues according to the following rules:
- After 90d of inactivity,
lifecycle/staleis applied - After 30d of inactivity since
lifecycle/stalewas applied,lifecycle/rottenis applied - After 30d of inactivity since
lifecycle/rottenwas applied, the issue is closed
You can:
- Reopen this issue with
/reopen - Mark this issue as fresh with
/remove-lifecycle rotten - Offer to help out with Issue Triage
Please send feedback to sig-contributor-experience at kubernetes/community.
/close not-planned
@k8s-triage-robot: Closing this issue, marking it as "Not Planned".
In response to this:
The Kubernetes project currently lacks enough active contributors to adequately respond to all issues and PRs.
This bot triages issues according to the following rules:
- After 90d of inactivity,
lifecycle/staleis applied- After 30d of inactivity since
lifecycle/stalewas applied,lifecycle/rottenis applied- After 30d of inactivity since
lifecycle/rottenwas applied, the issue is closedYou can:
- Reopen this issue with
/reopen- Mark this issue as fresh with
/remove-lifecycle rotten- Offer to help out with Issue Triage
Please send feedback to sig-contributor-experience at kubernetes/community.
/close not-planned
Instructions for interacting with me using PR comments are available here. If you have questions or suggestions related to my behavior, please file an issue against the kubernetes/test-infra repository.