Multi-Dimentional-Data-Analytics-of-Road-Accidents-in-India
 Multi-Dimentional-Data-Analytics-of-Road-Accidents-in-India copied to clipboard
Multi-dimensional Analytics Project on Road Accidents of India.
Road Accidents In India
A statistical data analysis project on Road Accidents of India over a period of 5-7 years using various Python Libraries.
The project is performed using Jupyter Notebook and Tableau.
Process :
I am analysing various datasets regarding Road Accidents of India gathered from Open Government Data Platform.
Python Libraries Used :
- Pandas
- Numpy
- Seaborn
- Matplotlib
Analysis :
- Jupyter Notebook
- Analysing accidents PER LAKH population of the state.
- Analysis of accidents according to the GENDER of OFFENDER and the VICTIM.
- Understanding the occurence of accidents because of improper, ignorant use of VEHICLE SAFETY ACCESSORIES like helmets, seat belts.
- Analysing road accidents based upon the NUMBER OF LANES of a road.
- Understanding the CAUSE AND REASONS behind the accidents, injuries and deaths of people.
- Analysis of accidents according to the TYPE OF VEHICLE.
- Tableau
- Analysis of accidents based upon the TIME OF OCCURENCE.
- Analysis of accidents as per the LOCATION of accident.
Sample Plots :
-
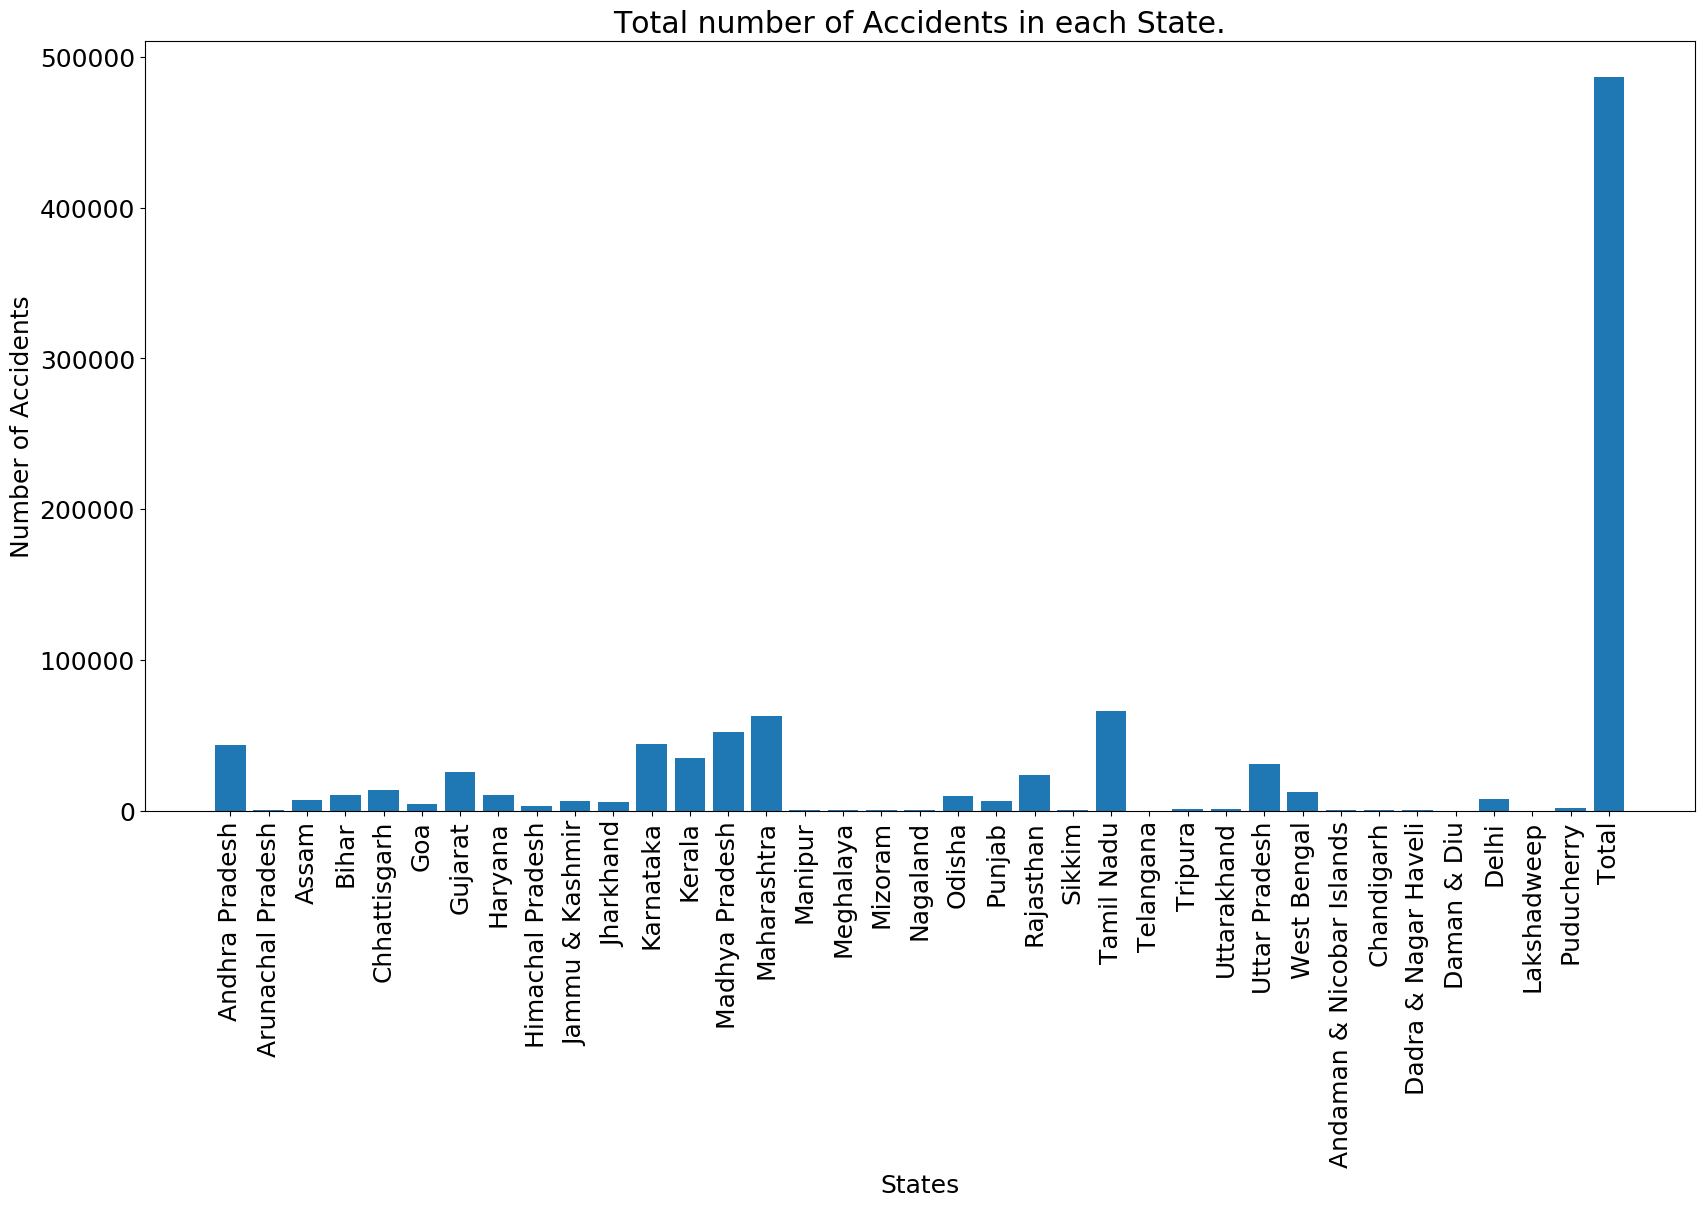
Overall accidents till 2016.
-
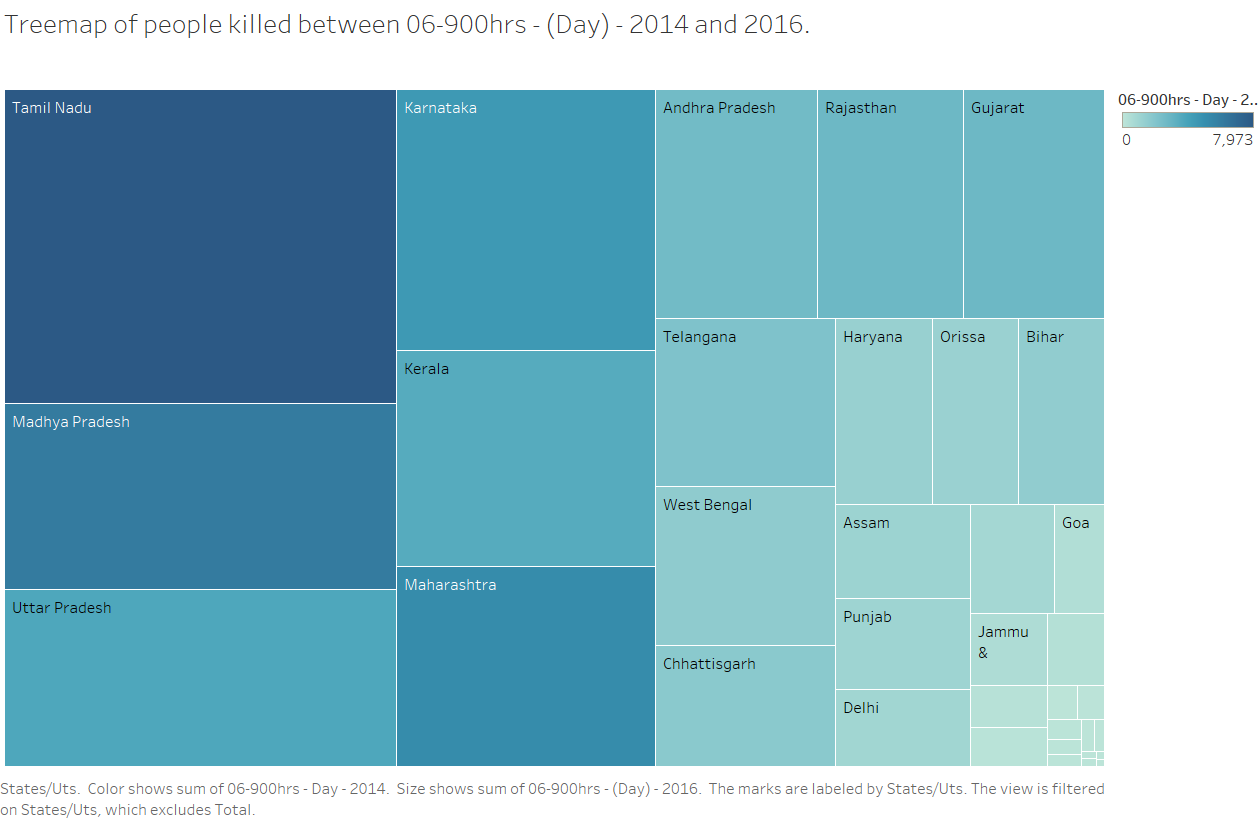
Accidents according to the TIME OF OCCURENCE.
-
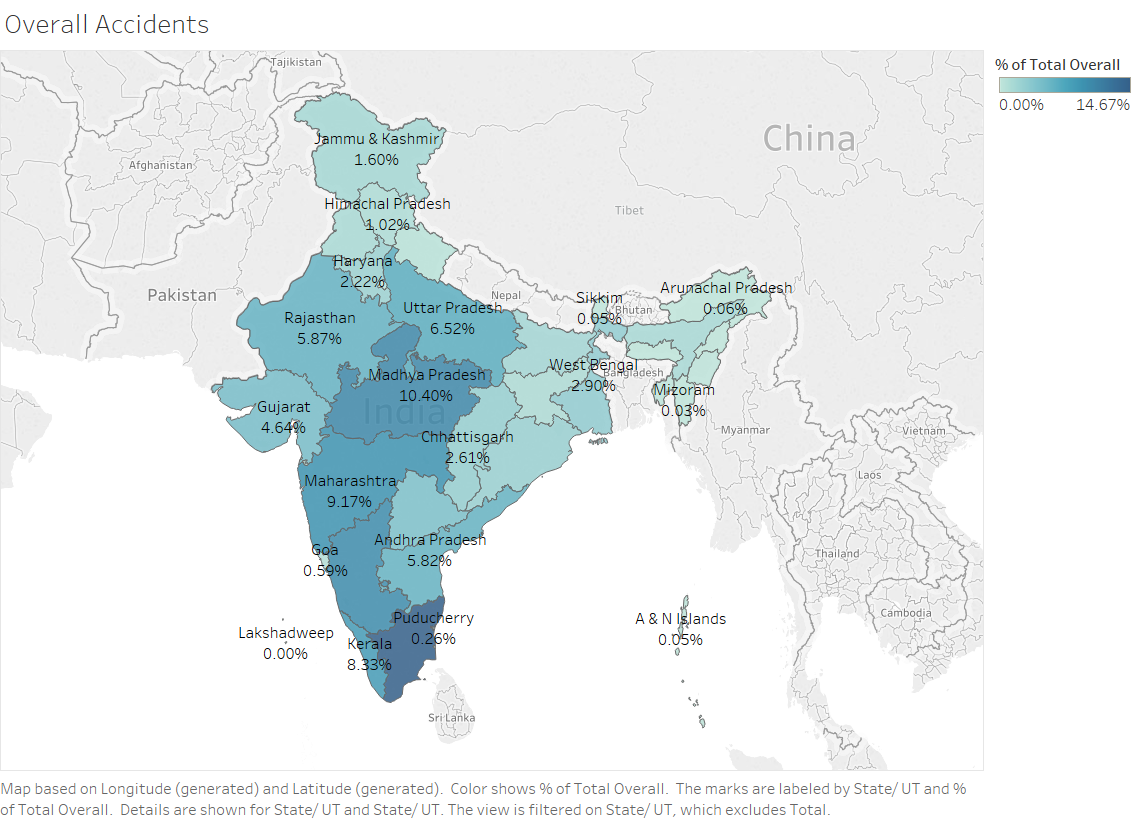
Count of accidents plotted over a MAP using Tableau.
-
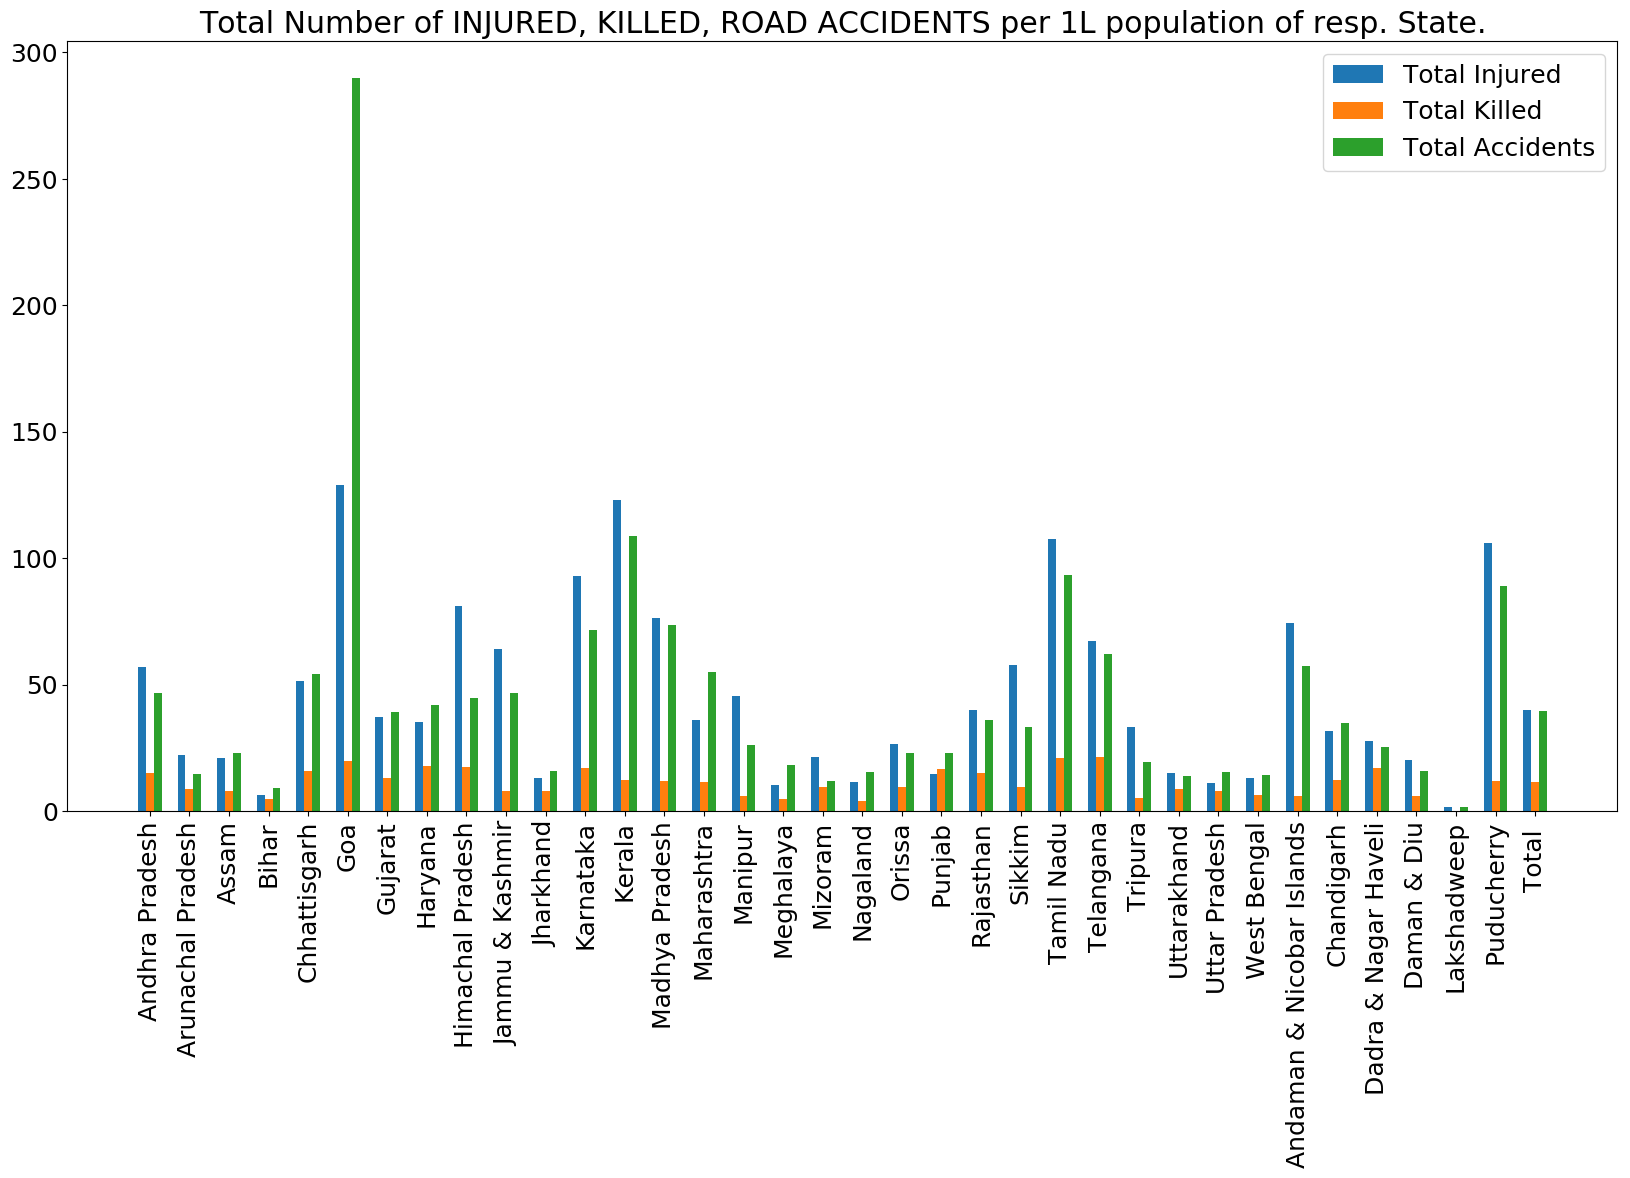
Total number of Accidents, Injuries, Deaths over 1 Lakh population of respective states.
Metadata
23
Stars
15
Forks
Watchers
Owner
Metadata
Multi-dimensional Analytics Project on Road Accidents of India.