domino
 domino copied to clipboard
Reports key metrics for docker containers
Domino 
Reports key metrics for docker containers.
###Overview
Reports key performance metrics for docker containers, including:
- CPU Usage %
- Memory limit
- Memory usage
- Network in
- Network out
- Disk Activity (coming soon)
- Container Events (coming soon)
Setup
Clone the repo:
git clone https://github.com/kamon-io/docker-monitor.git
###Configuration
In application.conf we must specify a comma-separated list of container IDs and an alias in order to facilitates the visualization and host and port of Docker daemon.
docker {
  # The Docker Host.
  host = "127.0.0.1"

  # The Docker TCP port.
  port = 2375

  # List of images they need to be monitored.
  # For convenience must provide an alias in order to facilitate the visualization
  # [{"container-id","container-alias"}]
  containers = [{"container-1":"awesome-container-1"}]
}
Build
Run the assembly task:
sbt assembly
Run
To run the default:
java -jar domino.jar
###Overriding configuration file
System properties can be used to force a different config source:
- config.resource:
java -jar domino.jar -Dconfig.resource=whatever.conf - config.file:
java -jar domino.jar -Dconfig.file=conf/environments/dev/other.conf - config.url:
java -jar domino.jar -Dconfig.url=http://site.com/my/awesome/configuration.conf
These system properties specify a replacement for application.conf, not an addition.
For the impatient
just download the release jar and run the following:
java -jar domino.jar -Dconfig.resource=whatever.conf
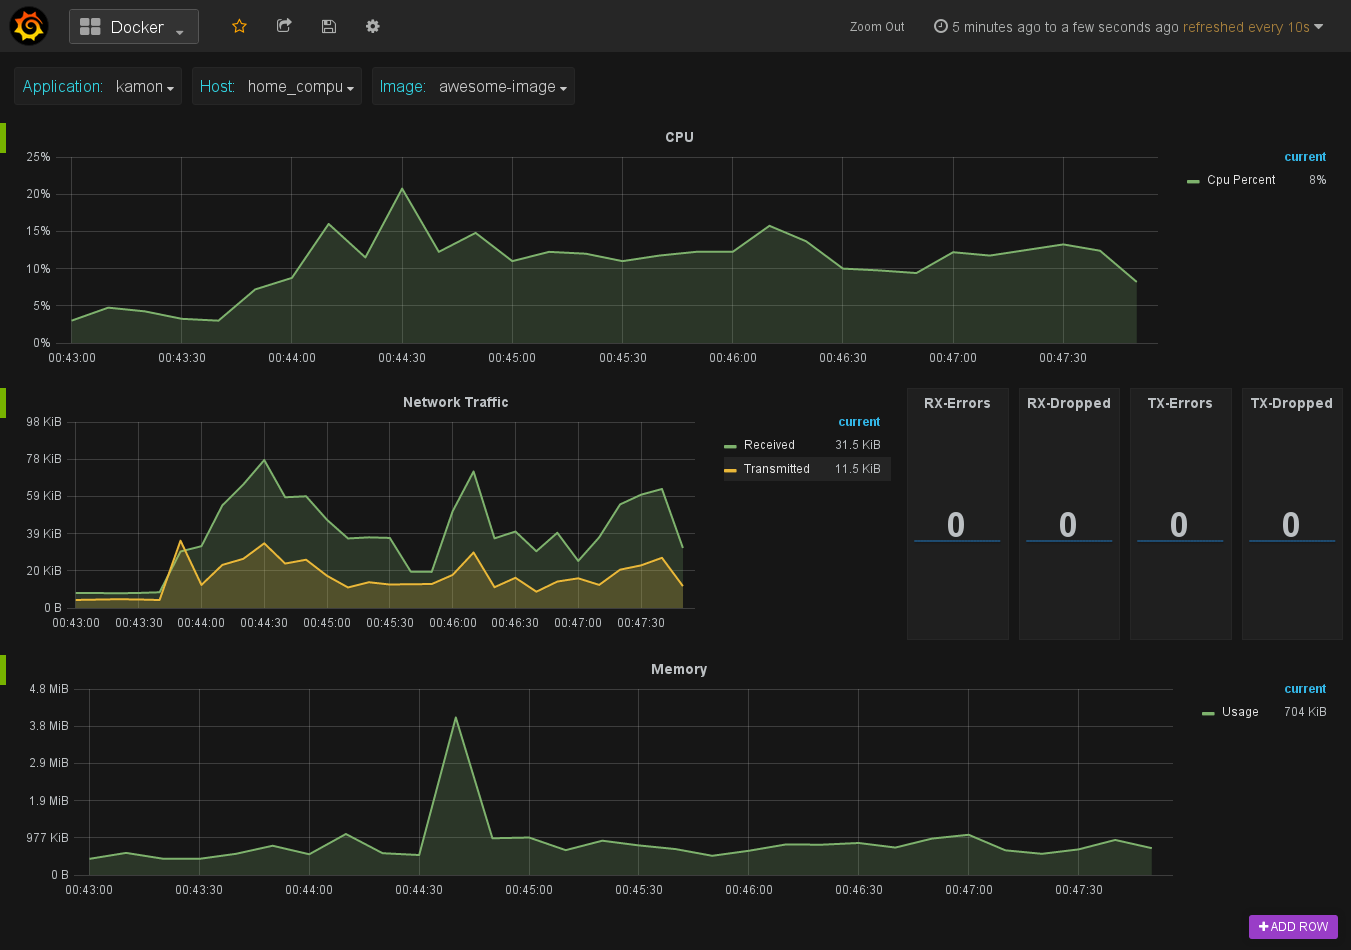
Visualization
By default the application is configured for use with StatsD through Kamon. For this reason, the only thing what we need is our Docker-Grafana-Graphite image that have a built-in Docker dashboard.
To start a container with this image you just need to run the following command:
docker run -d -p 80:80 -p 8125:8125/udp -p 8126:8126 --name kamon-grafana-dashboard kamon/grafana_graphite
###Future work
Possible future work for this tool includes:
- Include
Disk Utilizationmetrics - Monitoring of
Docker Events - Docker package