ipyleaflet
 ipyleaflet copied to clipboard
Plot spatial function like contourf?
Hi all,
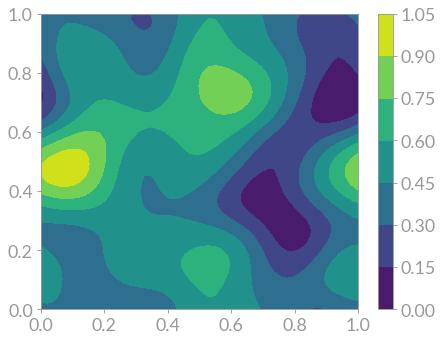
Just wondering if I could plot a function of space on the map, like so:

Is a choropleth the only option right now? Two reasons I'm hesitant to go that route:
- Creating a choropleth for the 3000+ counties in the USA is taking a very long time. Perhaps that's more glyphs than leaflet was intended to handle?
- Color boundaries are defined by geography rather than the function. I would prefer either no distinct color boundaries or something like matplotlib's contourf:
The heatmap calculates the KDE and plots it, so obviously this is possible under the hood, just wondering if there's any way to access this from a jupyter notebook.

Thanks! Oliver
Hi Oliver,
Another option is to do all the data processing in a NumPy array, and just project it on the map. There is an example here: https://github.com/jupyter-widgets/ipyleaflet/blob/master/examples/Numpy.ipynb
You wouldn't get much interaction with it though... I don't know if that is a big deal for you
Interaction is always nice, but not crucial for my current use case. Maybe we can leave this issue open as a feature request for a more interactive, widget-native way to plot geographic data
Hi, In order to get geojson contour from a data_array, I had written some function based on geoview. It is not as nice and fast as I expected first but can do the job if one wants some interactivity.
This gives results like this from a two dimensionnal data_array.

I join an example with the input data as netcdf and the function used in a notebook if that can help someone.
contourf_example.zip
I have made an example of how to use matplotlib.pyplot.contourf to obtain the polygons that can be later plot in ipyleaflet Choropleth. However, each path returned by contourf is composed by one vector with all the vertices, and a second one with codes. I am not sure how to use them properly in order to solve some artifacts that appear as seen below.
import numpy as np
import matplotlib
import matplotlib.pyplot as plt
import ipyleaflet
from ipyleaflet import Map, LegendControl
from branca.colormap import linear

nlon, nlat = (200, 200)
lon = np.linspace(-7, 7, nlon)
lat = np.linspace(-5, 5, nlat)
lonv, latv = np.meshgrid(lon, lat, indexing='ij')

x = np.vstack((lonv.flatten(), latv.flatten())).T
y = np.sin(latv) + np.cos(lonv)

fig, ax = plt.subplots(1, figsize=(12, 9))
cs = ax.contourf(lonv, latv, y.reshape(lonv.shape), alpha=0.8)
plt.colorbar(cs)

regions = {
    "type": "FeatureCollection",
    "features":[]
}

levels_list = []
for collection in cs.collections:
    levels_list.append([])
    paths_list = collection.get_paths()
    for path in paths_list:
		# Not sure how to use the following codes
		# path.codes
        levels_list[-1].append(path.vertices.tolist())

colors = {str(i): i/(len(cs.levels)) for i in range(len(cs.levels))}

for i, polygon_list in enumerate(levels_list):
    for polygon in polygon_list:
        regions["features"].append({
                "type":"Feature",
                "id":str(i),
                "properties":{"name":"contours"},
                "geometry":{
                    "type":"Polygon",
                    "coordinates": [polygon]
                }
            })

layer = ipyleaflet.Choropleth(
    geo_data=regions,
    choro_data=colors,
    colormap=linear.viridis,
    border_color='black',
    style={'fillOpacity': 0.5,
           'color': 'none',
           'dashArray': '5, 5'})

m = Map(center=(0, 0), zoom=6)
m.add_layer(layer)

legend_colors = {}
for i in reversed(range(len(cs.levels)-1)):
    legend_colors["{:0.1f}-{:0.1f}".format(cs.levels[i], cs.levels[i+1])] = linear.viridis(i/(len(cs.levels)-1))

legend = LegendControl(legend_colors, position="topright")
m.add_control(legend)

m

I have found a solution in a StackOverlfow thread https://stackoverflow.com/questions/65634602/plotting-contours-with-ipyleaflet
By using the following split_contours function
def split_contours(segs, kinds=None):
    """takes a list of polygons and vertex kinds and separates disconnected vertices into separate lists.
    The input arrays can be derived from the allsegs and allkinds atributes of the result of a matplotlib
    contour or contourf call. They correspond to the contours of one contour level.

    Example:
    cs = plt.contourf(x, y, z)
    allsegs = cs.allsegs
    allkinds = cs.allkinds
    for i, segs in enumerate(allsegs):
        kinds = None if allkinds is None else allkinds[i]
        new_segs = split_contours(segs, kinds)
        # do something with new_segs

    More information:
    https://matplotlib.org/3.3.3/_modules/matplotlib/contour.html#ClabelText
    https://matplotlib.org/3.1.0/api/path_api.html#matplotlib.path.Path
    Source:
    https://stackoverflow.com/questions/65634602/plotting-contours-with-ipyleaflet
    """
    if kinds is None:
        return segs    # nothing to be done
    # search for kind=79 as this marks the end of one polygon segment
    # Notes:
    # 1. we ignore the different polygon styles of matplotlib Path here and only
    # look for polygon segments.
    # 2. the Path documentation recommends to use iter_segments instead of direct
    # access to vertices and node types. However, since the ipyleaflet Polygon expects
    # a complete polygon and not individual segments, this cannot be used here
    # (it may be helpful to clean polygons before passing them into ipyleaflet's Polygon,
    # but so far I don't see a necessity to do so)
    new_segs = []
    for i, seg in enumerate(segs):
        segkinds = kinds[i]
        boundaries = [0] + list(np.nonzero(segkinds == 79)[0])
        for b in range(len(boundaries)-1):
            new_segs.append(seg[boundaries[b]+(1 if b>0 else 0):boundaries[b+1]])
    return new_segs
The previous code to generate the contourmap needs the latitude and longitude to be swap.
fig, ax = plt.subplots(1, figsize=(12, 9))
cs = ax.contourf(latv, lonv, y.reshape(lonv.shape), alpha=0.8)
Finally the code is simplified.
from ipyleaflet import Map, basemaps, Polygon

m = Map(center=(0, 0), zoom=6)

colors = [linear.viridis(i/(len(cs.levels)-1)) for i in range(len(cs.levels))]
allsegs = cs.allsegs
allkinds = cs.allkinds

for clev in range(len(cs.allsegs)):
    kinds = None if allkinds is None else allkinds[clev]
    segs = split_contours(allsegs[clev], kinds)
    polygons = Polygon(
                    locations=[p.tolist() for p in segs],
                    # locations=segs[14].tolist(),
                    color=colors[clev],
                    weight=1,
                    opacity=0.8,
                    fill_color=colors[clev],
                    fill_opacity=0.5
    )
    m.add_layer(polygons);

legend_colors = {}
for i in reversed(range(len(cs.levels)-1)):
    legend_colors["{:0.1f}-{:0.1f}".format(cs.levels[i], cs.levels[i+1])] = linear.viridis(i/(len(cs.levels)-1))

legend = LegendControl(legend_colors, position="topright")
m.add_control(legend)

m
