ClusterGVis
 ClusterGVis copied to clipboard
add.bar does not work as expected
Hi Jun,
Thanks for developing this great package. However, when I use it, I notice some issues.
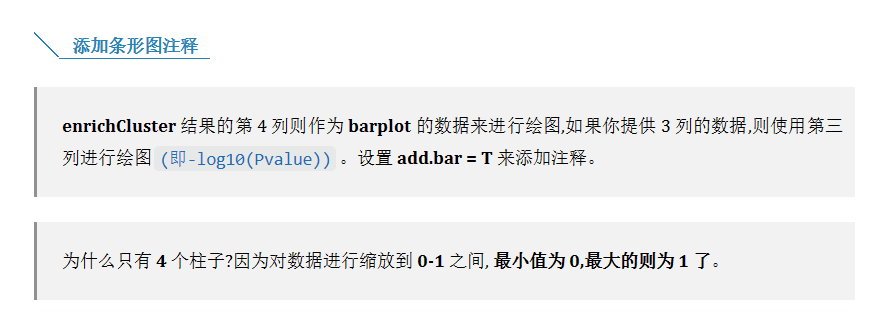
I use add.bar to add a bar plot for GO, which I thought would be -log10pvalue. However, it turns out it uses the ratio rather than the p-value.
Using ratio is fine, but the default GO label is ordered by p-value, so creating inconsistency, and moreover, the GO barplot only have a maximum of 4 bars even when I supply the enrichment table with 5 GO terms for each cluster.
Here is a screenshot of a cluster
 You can see the bar plot and GO term labels are not ordered in the same way, and missing 1 term as well.
You can also see the enrichment table for this cluster is like this.
You can see the bar plot and GO term labels are not ordered in the same way, and missing 1 term as well.
You can also see the enrichment table for this cluster is like this.

And this is the code I used to plot the figure:
visCluster(object = gene_ck10,
           plot.type = "both",
           annoTerm.data = enrich_ck10,
           add.box = T, show_row_dend = F, add.bar = T,
           line.side = "left",
           markGenes.side = "left",
           boxcol = rep(hue_pal()(4)[1:2], each = 4),
           sample.col	= rep(c(hue_pal()(4)[c(1,4,3)], "#808080"), 2))
Could you please have a look if this is a bug, or I have done something wrong?
Cheers,
Thanks for showing this.
Yes I can understand it uses the 4th column for the bar plot, and scales between 0 to 1. But it does look misleading, because 0 is not shown as a bar.
Also, I would assume the order of GO terms and bars to be the same at least, but it is not the case now.
And the GO table is arranged by pvalue instead of ratio. And some bugs I will fix, thanks for your advice.