tsai
 tsai copied to clipboard
Bug: show_batch() function displays wrong plot when used with TSImage()
The show_batch() function is not working as expected along with any of the time series to image transformations.
Steps to reproduce
Run the TS to Image tutorial notebook.
Expected behavior
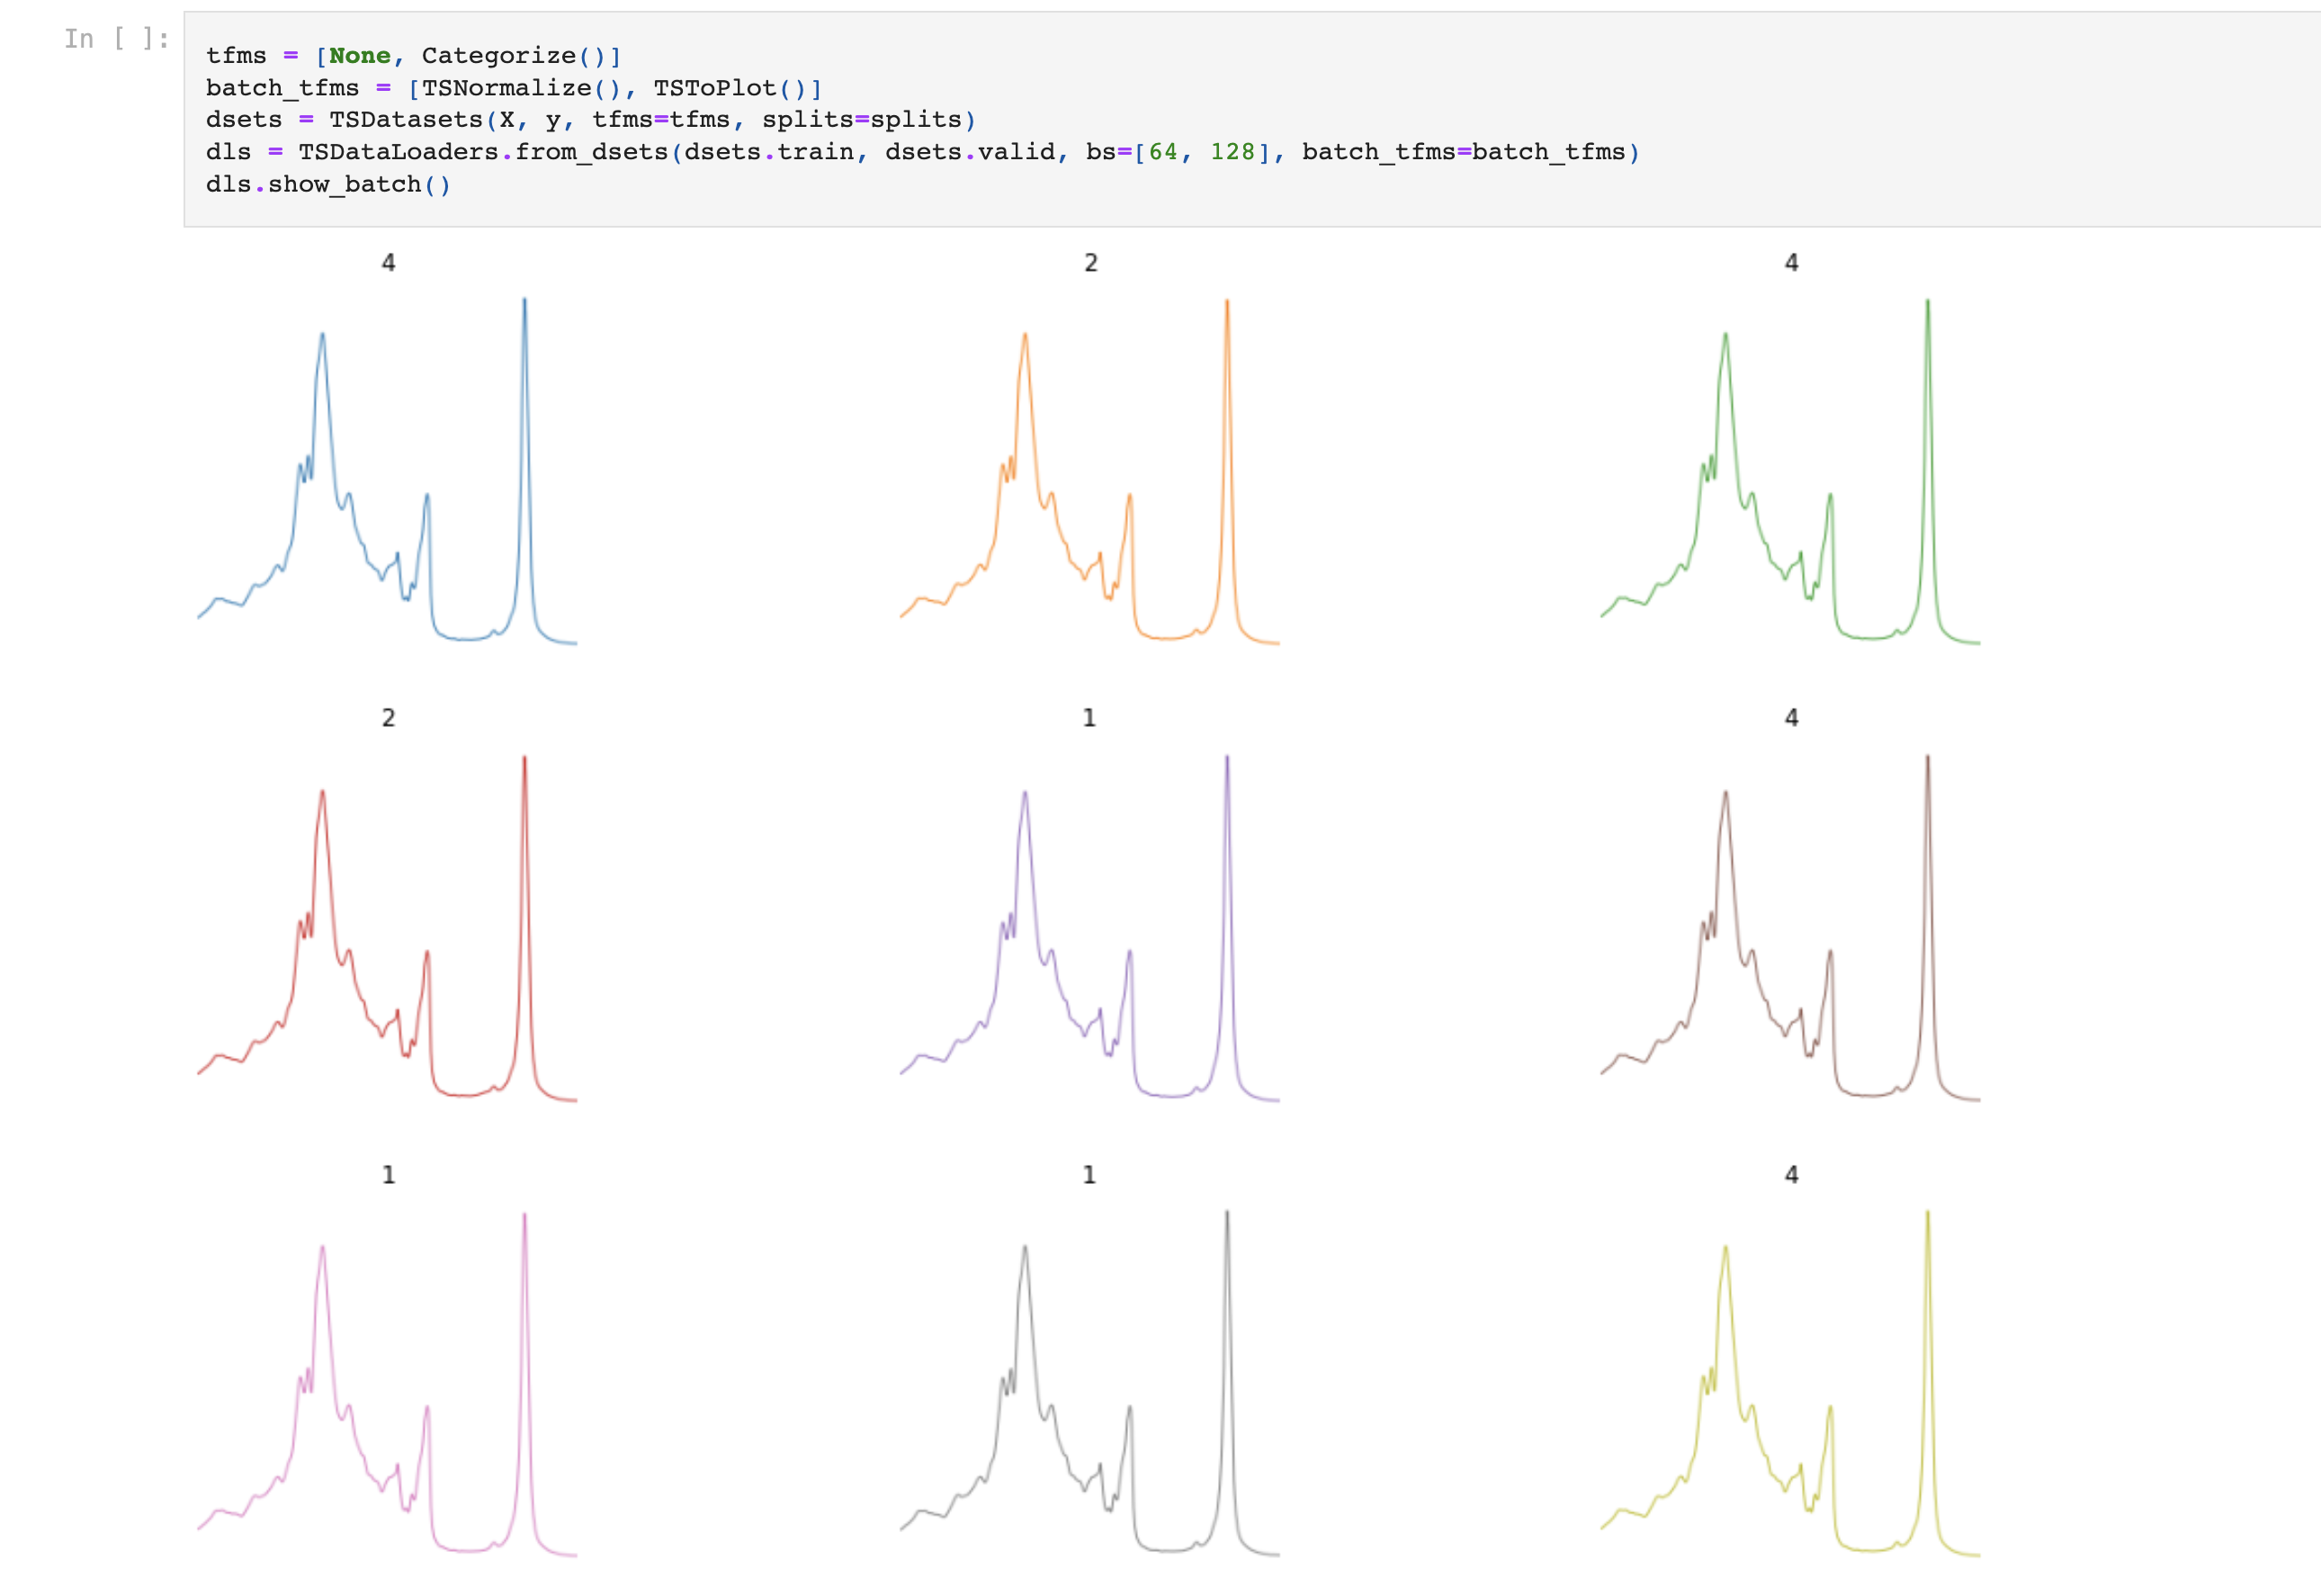
The show_batch() function on the dls after TSToPlot (or any other trasformation) looks like this:
Observed behavior
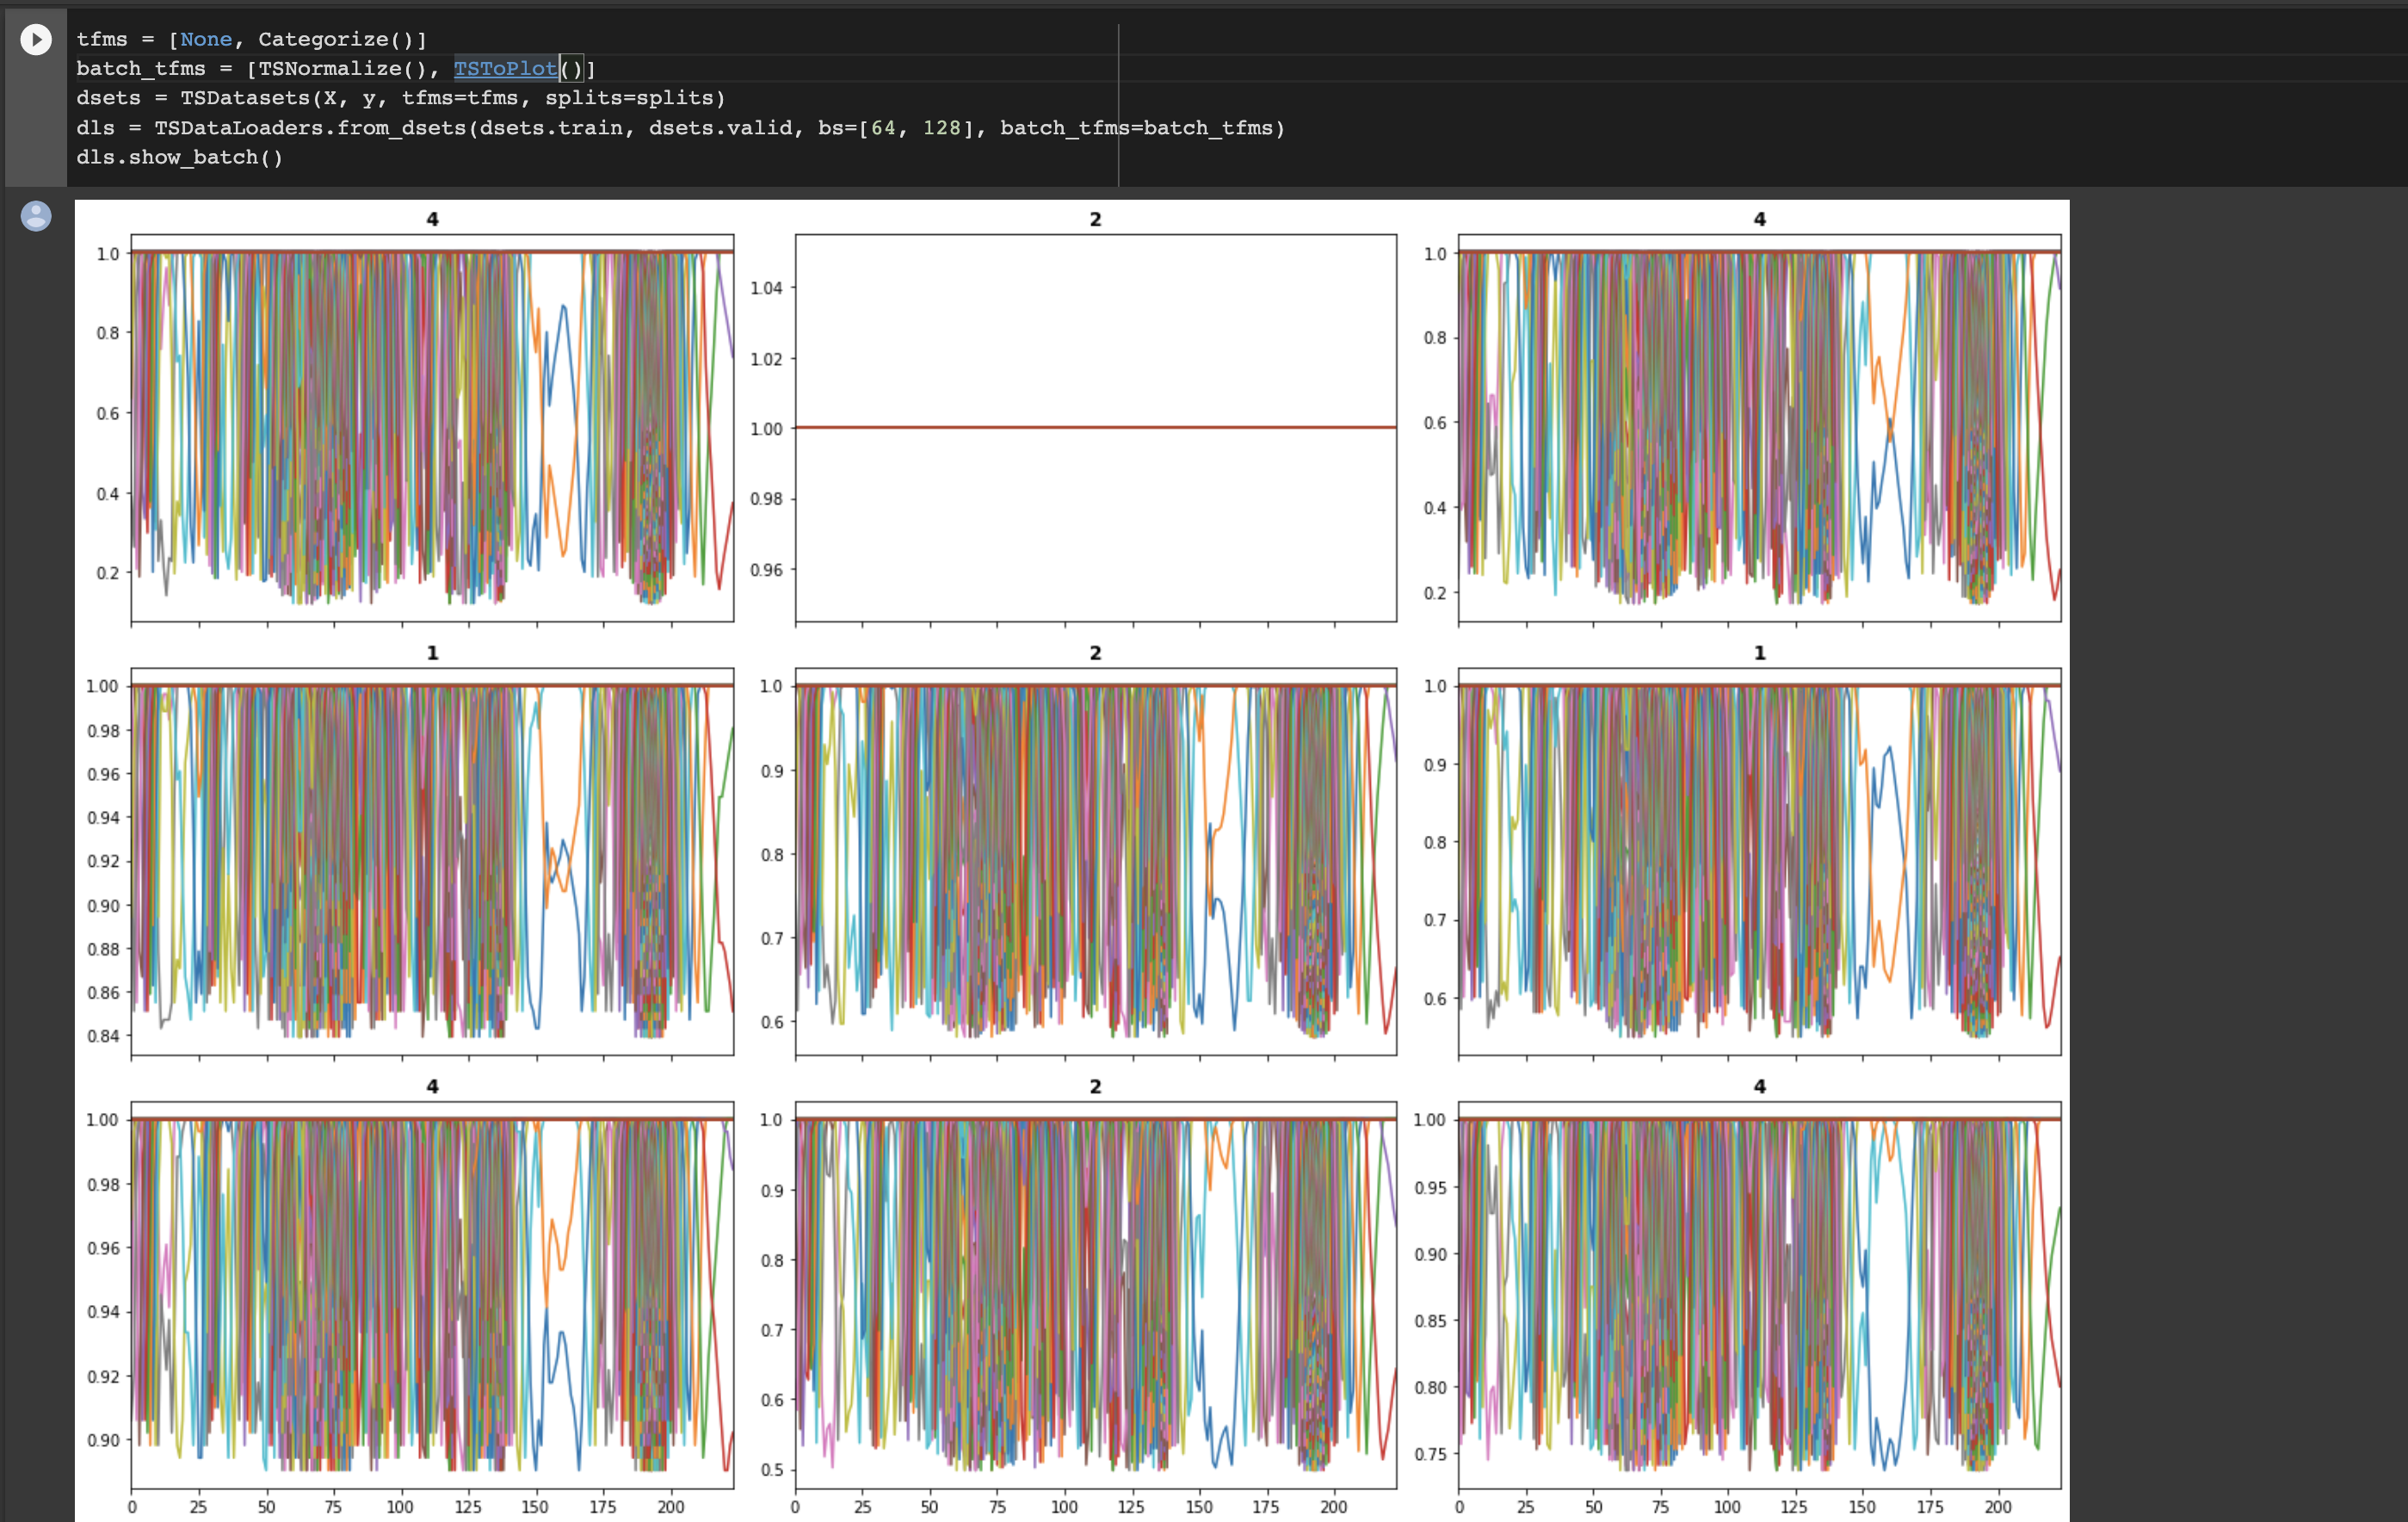
Insted now the show_batch() function gives this:
Additional Information
I tried iterating through the dls and checking what the plots look like and they seem fine.
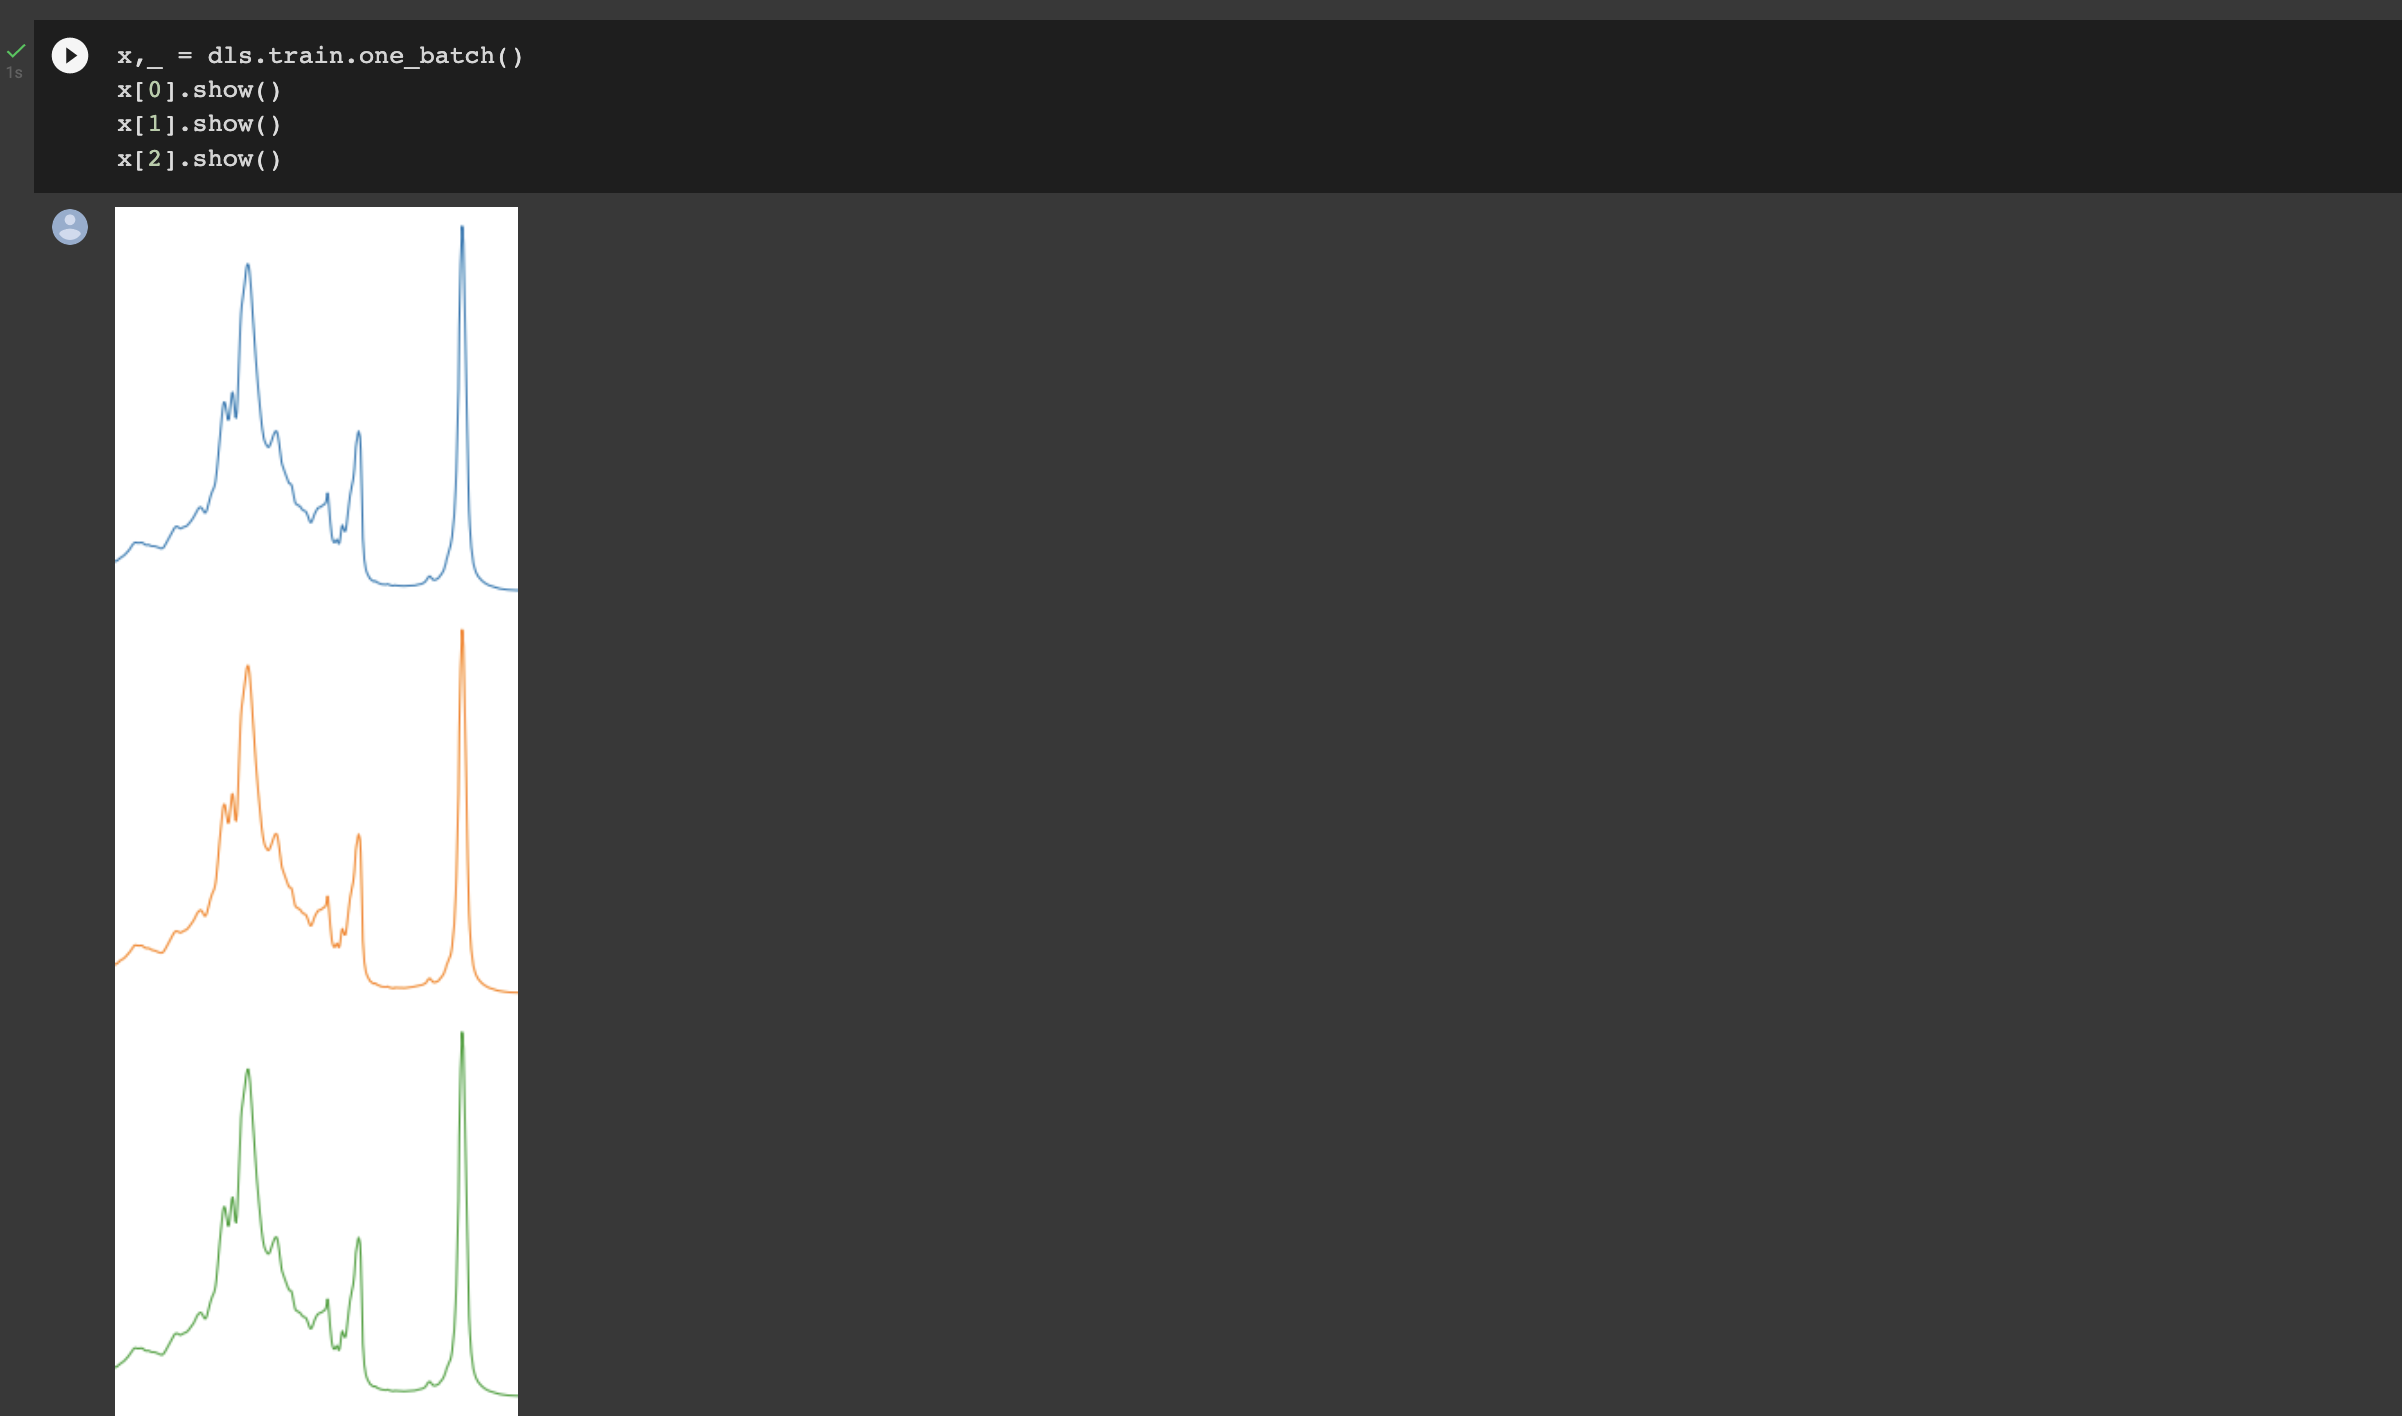
This gives me the impression that the issue is with how show_batch() is working and not the transformations themselves.
In this issue I have explained how this is effecting TSToPlot trasformation but if you try the other once like TSToMat, TSToGADF etc... show_batch() gives some weird graphs as output.