holoviews
 holoviews copied to clipboard
[Question] Any solution for infinite vertical and/or horizontal lines that show up in the plot legend?
Hello,
Is there any equivalent for matplotlib's pyplot.axvline and pyplot.axhline? hv.Spikes can't currently have infinite length and hv.VLine and hv.HLine don't show up in the legend. Possible fixes:
hv.Spikewith infinite length (infinite length would be a special case, as this element would not impose limits on the plot bounds)hv.VLineandhv.HLinecan be added to the legend (which would require a major Bokeh restructure, if i understand correctly; also, they don't resize the plot)- have the ability to add arbitrary elements to the legend.
Currently, the only workaround is to plot a hv.VLine over a hv.Spikes, but this is a bit messy and does not work for horizontal lines. How are we supposed to draw absolute thresholds and limits on a plot? How do we draw a 3 sigma limit on a histogram, for example?
References:
#3759 for hv.VLine and hv.HLine plot bounds resizing
I'm a bit confused; why would 3-sigma limits and thresholds show up in a legend? How would the legend distinguish between any of those, as lines? The legend normally labels the actual data, with some color or dash differences to distinguish different data traces. Maybe a mockup would help here.
Firstly, in my original comment, i meant pyplot.axvline and pyplot.axhline, not pyplot.vline and pyplot.hline.
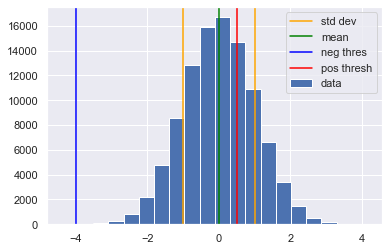
Well, i want them to show up in a legend because i could have lots of lines on one distribution, and it may not be apparent what each line means. Compare this:

With this:
Much clearer. What's worse, the distribution itself may not be a normal distribution, so what may look like a 3 sigma line could be something else entirely. On top of that, the legend labels could provide extra information. Rather than eyeing that threshold and say 'It's about -4...', you can explicitly say so. Like so:
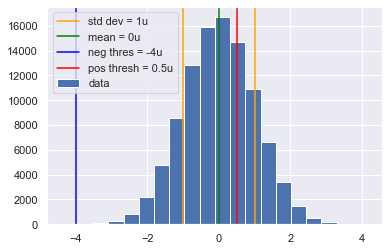
All of a sudden, my plot can now hold a lot more information in a much clearer manner. I don't need to have an extra table or something similar describing all those values. I can simply add all the relevant data in the legend.
In conclusion, the answer to your question is: Why not?
Edit: just because i'm using a histogram here doesn't mean this is applicable only to histograms. It should apply to any other type of plot. Could have thresholds on curve plots, limits on a scatter plot, etc. Same principles apply.
That's perfect, thanks! Definitely not what I was imagining from your initial description. Sure, this would be very good to support.
For now, the option apply_ranges=False applied to an element removes it from the range computation:
you could use it to draw lines that extend outside the axis ranges.
@ea42gh I suppose that could work. Would probably create issues when moving the plot about.
Thanks for the tip.
Or just use a Curve or Segments element, and if you really need to have the infinite extent you can overlay an HLine or VLine.
Does someone know the reason why VLine and HLine don't appear in the legend?
Edit: OK just found why (https://github.com/holoviz/holoviews/issues/2339#issuecomment-470628428)
Not having them in the legend was a deliberate choice in the design of Bokeh, and I get it, since that's often metadata rather than plots, but my personal view is that such choices should only be defaults, not constraints. I.e. by default, something that's typically used for annotation would not show up in the legend, but a particular user could be using any particular visible element for any particular purpose, and so they should be able to override the default. Based on https://github.com/bokeh/bokeh/pull/13344 I think the Bokeh team agrees to try to eliminate differences between glyphs and annotations, but I see that PR isn't merged, so I'm not sure. @mattpap, can you give an update here?
With PR https://github.com/bokeh/bokeh/pull/13344 we want to eliminate data annotations and have only class of models which are data driven (i.e. glyphs). Annotations will remain, but only as "scalar" entities (like existing BoxAnnotation). However, we still intend to allow annotations to be rendered in legends (https://github.com/bokeh/bokeh/issues/12117) and allow general drawing on the canvas in all contexts, in particular in legends, for which a preliminary "shapes" (scalar glyphs) API was developed in PR https://github.com/bokeh/bokeh/pull/13279.