Generation is order of magnitude slower than FsCheck
Hedgehog generates strings (haven't tested other types) more than an order of magnitude slower than FsCheck.
I discovered this after converting tests from FsCheck to Hedgehog and noticing a drastic slowdown of the test suite.
Code to test:
module H =

  open Hedgehog

  let s = Gen.string (Range.singleton 10) Gen.alphaNum

  let check () = s |> Gen.sample 0 10000

module F =

  open FsCheck

  let alphaNum = ['0'..'9'] @ ['A'..'Z'] @ ['a'..'z']

  let s = Gen.elements alphaNum
          |> Gen.listOfLength 10
          |> Gen.map (fun cs -> System.String.Concat(Array.ofList(cs)))

  let check () = s |> Gen.sample 0 10000
Result of interactive execution using #time:
> F.check();;
> Real: 00:00:00.057, CPU: 00:00:00.062, GC gen0: 11, gen1: 0, gen2: 0
val it : string list =
  ["mj3bVSmKEY"; "smj3bVSmKE"; "Ksmj3bVSmK"; "dKsmj3bVSm"; "OdKsmj3bVS";
   "LOdKsmj3bV"; "VLOdKsmj3b"; "7VLOdKsmj3"; "X7VLOdKsmj"; "xX7VLOdKsm"; ...]

> H.check();;
> Real: 00:00:01.838, CPU: 00:00:01.890, GC gen0: 52, gen1: 14, gen2: 3
val it : List<string> =
  ["ffmhtVdB5q"; "283b0i3P88"; "RZUYtob07L"; "PSEp4C9Q1c"; "PkPv63NQ83";
   "b9Gnw9ZN7N"; "3HFgXJB5tl"; "TcwRo7AjON"; "HfZGkhHb0h"; "Oj6Fg0RyBw"; ...]
Notice the insane difference: 57 ms for FsCheck vs. 1838 ms for Hedgehog.
Actually it happens with simple ints too. See below (I have assumed that by default, FsCheck generates ints from -100 to 100 at max size):
module H =

  open Hedgehog

  let i = Gen.int (Range.constant -100 100)
  let check () = i |> Gen.sample 100 100000

module F =

  open FsCheck

  let i = Arb.generate<int>
  let check () = i |> Gen.sample 100 100000
Result:
> F.check();;
>
Real: 00:00:00.035, CPU: 00:00:00.046, GC gen0: 3, gen1: 0, gen2: 0
val it : int list =
  [-11; 100; 16; 40; -27; 71; -99; 28; -54; -74; -95; -58; 96; -39; -18; -19;
   18; 55; 19; -91; 29; -81; 39; -71; 49; -61; 59; -51; 69; -41; 79; -31; 89;
   -21; 99; -11; -92; -1; -82; 9; -72; 19; -62; 29; -52; 39; -42; 49; -32; 59;
   -22; 69; -12; 79; -2; 89; 8; 99; 18; -92; 28; -82; 38; -72; 48; -62; 58;
   -52; 68; -68; 52; -58; 62; -48; 72; -38; 82; -28; 92; -18; -99; -8; -89; 2;
   -79; 12; -69; 22; -59; 32; -49; 42; -39; 52; -29; 62; -19; 72; -9; 82; ...]

> H.check();;
> Real: 00:00:00.483, CPU: 00:00:00.500, GC gen0: 22, gen1: 5, gen2: 1
val it : List<int> =
  [68; 65; 19; 78; 20; -4; -50; 39; 44; 13; 5; 0; -26; 29; 94; -96; -59; -65;
   67; 80; 16; 22; 63; -29; 24; 58; 74; -77; -24; -81; -1; 4; 64; 30; 23; 86;
   92; -81; -96; -94; 55; 28; 99; -63; -75; -33; -43; -94; -74; -85; -29; -37;
   -33; 10; -37; 6; 1; -9; -98; -21; 5; 40; -80; 56; -52; 19; 62; -12; -71; -3;
   -29; -77; -82; 36; -90; 27; 9; -52; -99; -38; 4; -2; -9; -92; 96; 59; 27;
   44; -34; -29; 42; 78; 29; 18; -85; -82; -17; 10; -11; -71; ...]
Notice again the time: 35 ms vs 483 ms.
Thrilled as I am about Hedgehog (as you probably can tell from the number of issues I've posted the last few days), I'm sad to say that an order-of-magnitude difference in test suite run time is likely a deal-breaker for me. I hope this is a bug that can be fixed, and not an unavoidable side-effect of some fundamental Hedgehog functionality (such as integrated shrinking causing massive slowdowns). 😞
I hope this is a bug that can be fixed, and not an unavoidable side-effect of some fundamental Hedgehog functionality (such as integrated shrinking causing massive slowdowns).
We haven't spent any effort optimising hedgehog so far, so I'm sure there is some low hanging fruit. I have a suspicion that we might be doing more work than necessary in some places as the logic has been ported from the Haskell version where everything is lazy, so I didn't need to think about which things should actually be lazy.
I've had a cursory glance at some profiling data now.
First I profiled this:
let g = Gen.int <| Range.constantBounded()
g |> Gen.sample 99 500000 |> ignore
For this, it seems that Hedgehog.Seed.nextBigInt is the most significant time drain (41%), followed by Hedgehog.Tree.unfoldForest (36%). Drilling into unfoldForest, it seems that (|Cons|Nil|) active pattern is hit pretty hard.
Another range:
let g = Gen.int <| Range.exponentialBounded()
g |> Gen.sample 1 500000 |> ignore
Here, Hedgehog.Range.bounds is the main culprit and is called 500000 times (is that necessary?), followed by nextBigInt`.
Another:
let g = Gen.int <| Range.linearFrom 0 -100 100
g |> Gen.sample 1 500000 |> ignore
The story here is similar to the one above. However, if I increase the size:
let g = Gen.int <| Range.linearFrom 0 -100 100
g |> Gen.sample 99 500000 |> ignore
then Hedgehog.Tree.unfoldForest also has a significant impact (again with (|Cons|Nil|) being hit hard).
Finally, let's try strings - first with low size:
let g = Gen.string (Range.linear 1 100) Gen.alphaNum
g |> Gen.sample 1 100000 |> ignore
This is more complicated, but it seems that a lot of time is spent in the inner function in Hedgehog.Random.bind.
Then let's try with high size:
let g = Gen.string (Range.linear 1 100) Gen.alphaNum
g |> Gen.sample 99 100000 |> ignore
Now, most of the time is spent in Hedgehog.Tree.bind and Hedgehog.Random.map.
I have no idea if this is helpful to you, but I figured there'd be no hurt in posting it.
Is there any reason the generation of BigInts is so convoluted? Perhaps it's because the code was ported from Haskell? Because if I use System.Random instead, I get a speedup of 2-3 times just from doing that.
Consider this:
let g1 = Gen.int (Range.exponentialBounded())

let rnd = System.Random()
let g2 = Gen.sized <| fun s ->
  gen {
    let l, u = Range.exponentialBounded() |> Range.bounds s
    return rnd.Next(l, u)
  }
When timing in F# interactive, running g1 |> Gen.sample 50 1000000;; takes around 10 seconds, while g2 |> Gen.sample 50 1000000;; takes 3-4 seconds.
The difference is even more dramatic when using constant ranges:
let g1 = Gen.int (Range.constantBounded())

let rnd = System.Random()
let g2 = Gen.sized <| fun s ->
  gen {
    return rnd.Next(System.Int32.MinValue, System.Int32.MaxValue)
  }
Now we're talking ~7 seconds vs. ~1 second.
For strings, the speedup is enormous (~50x):
let g1 = Gen.string (Range.linear 0 50) Gen.alphaNum

let rnd = System.Random()
let alphaNum = ['a'..'z'] @ ['A'..'Z'] @ ['0'..'9'] |> List.toArray
let g2 = Gen.sized <| fun s ->
  gen {
    let l, u = Range.linear 0 50 |> Range.bounds s
    let strLen = rnd.Next(l, u)

    return [0..strLen]
           |> List.map (fun _ ->
               let i = rnd.Next(0, alphaNum.Length-1)
               alphaNum.[i])
           |> System.String.Concat
  }
Running g1 |> Gen.sample 50 10000;; takes just over 2 seconds, while g2 |> Gen.sample 50 10000;; takes around 40 ms (yes, you read that right).
In general, there seems to be incredible speedups available from optimizing low-level generators.
Heck, even simple char generators get a significant speedup (I'd guess because the underlying int generation is slow, but I might be wrong):
let g1 = Gen.alphaNum

let rnd = System.Random()
let alphaNum = ['a'..'z'] @ ['A'..'Z'] @ ['0'..'9'] |> List.toArray
let g2 =
  gen {
    let i = rnd.Next(0, alphaNum.Length-1)
    return alphaNum.[i]
  }
Results: 1.7 seconds vs. 70 ms.
Very interesting! May I ask which tool(s) you used to profile? Visual Studio's built-in profiler? (If any)
Some tool in ReSharper Ultimate. Haven't used it before, but noticed when right-clicking tests in ReSharper's test explorer that I had the option to "profile unit tests", so I went ahead and tried that.
Note that the last couple of posts were timed using F# interactive, as I said.
@cmeeren @jystic FYI, I've requested an open-source license from ReSharper which might help in profiling.
I suspect that one nice win would be to replace LazyList<T> with a seq<T>, as long as we're careful to only evaluate it once... 🤔
Result of interactive execution using
#time:> F.check();; > Real: 00:00:00.057, CPU: 00:00:00.062, GC gen0: 11, gen1: 0, gen2: 0 val it : string list = ["mj3bVSmKEY"; "smj3bVSmKE"; "Ksmj3bVSmK"; "dKsmj3bVSm"; "OdKsmj3bVS"; "LOdKsmj3bV"; "VLOdKsmj3b"; "7VLOdKsmj3"; "X7VLOdKsmj"; "xX7VLOdKsm"; ...] > H.check();; > Real: 00:00:01.838, CPU: 00:00:01.890, GC gen0: 52, gen1: 14, gen2: 3 val it : List<string> = ["ffmhtVdB5q"; "283b0i3P88"; "RZUYtob07L"; "PSEp4C9Q1c"; "PkPv63NQ83"; "b9Gnw9ZN7N"; "3HFgXJB5tl"; "TcwRo7AjON"; "HfZGkhHb0h"; "Oj6Fg0RyBw"; ...]
#146 by @Porges has also improved performance in here:
> H.check ();;
Real: 00:00:01.453, CPU: 00:00:01.453, GC gen0: 49, gen1: 22, gen2: 0
val it : List<string> =
  ["zts8BaKmXU"; "JoOTpdd0U0"; "2uF0s4mcgH"; "h6rsnm384h"; "3PCQzHH9RJ";
   "DqlQ4fuByn"; "E06sPqP3UW"; "ha7C9IHZ1M"; "nJbSToj96d"; "7QYi2S48p5"; ...]
There must be some low hanging fruit here and there for sure, though.
I see Hedgehog has a lot more garbage collection, including gen1 and gen2. Perhaps that's a lead to follow.
I'm also curious to find out what happens after trying what @Porges suggests here:
I suspect that one nice win would be to replace
LazyList<T>with aseq<T>, as long as we're careful to only evaluate it once... 🤔
I've tried it and it seems like a slight win. I need to do some proper benchmarking though, at the moment only the 'minimal test' really exercises the Tree type at all.
I think there are bigger wins to be had elsewhere, since in "normal operation" (your tests passing), this codepath doesn't get hit as Hedgehog doesn't need to shrink anything.
Memory traffic by dotMemory
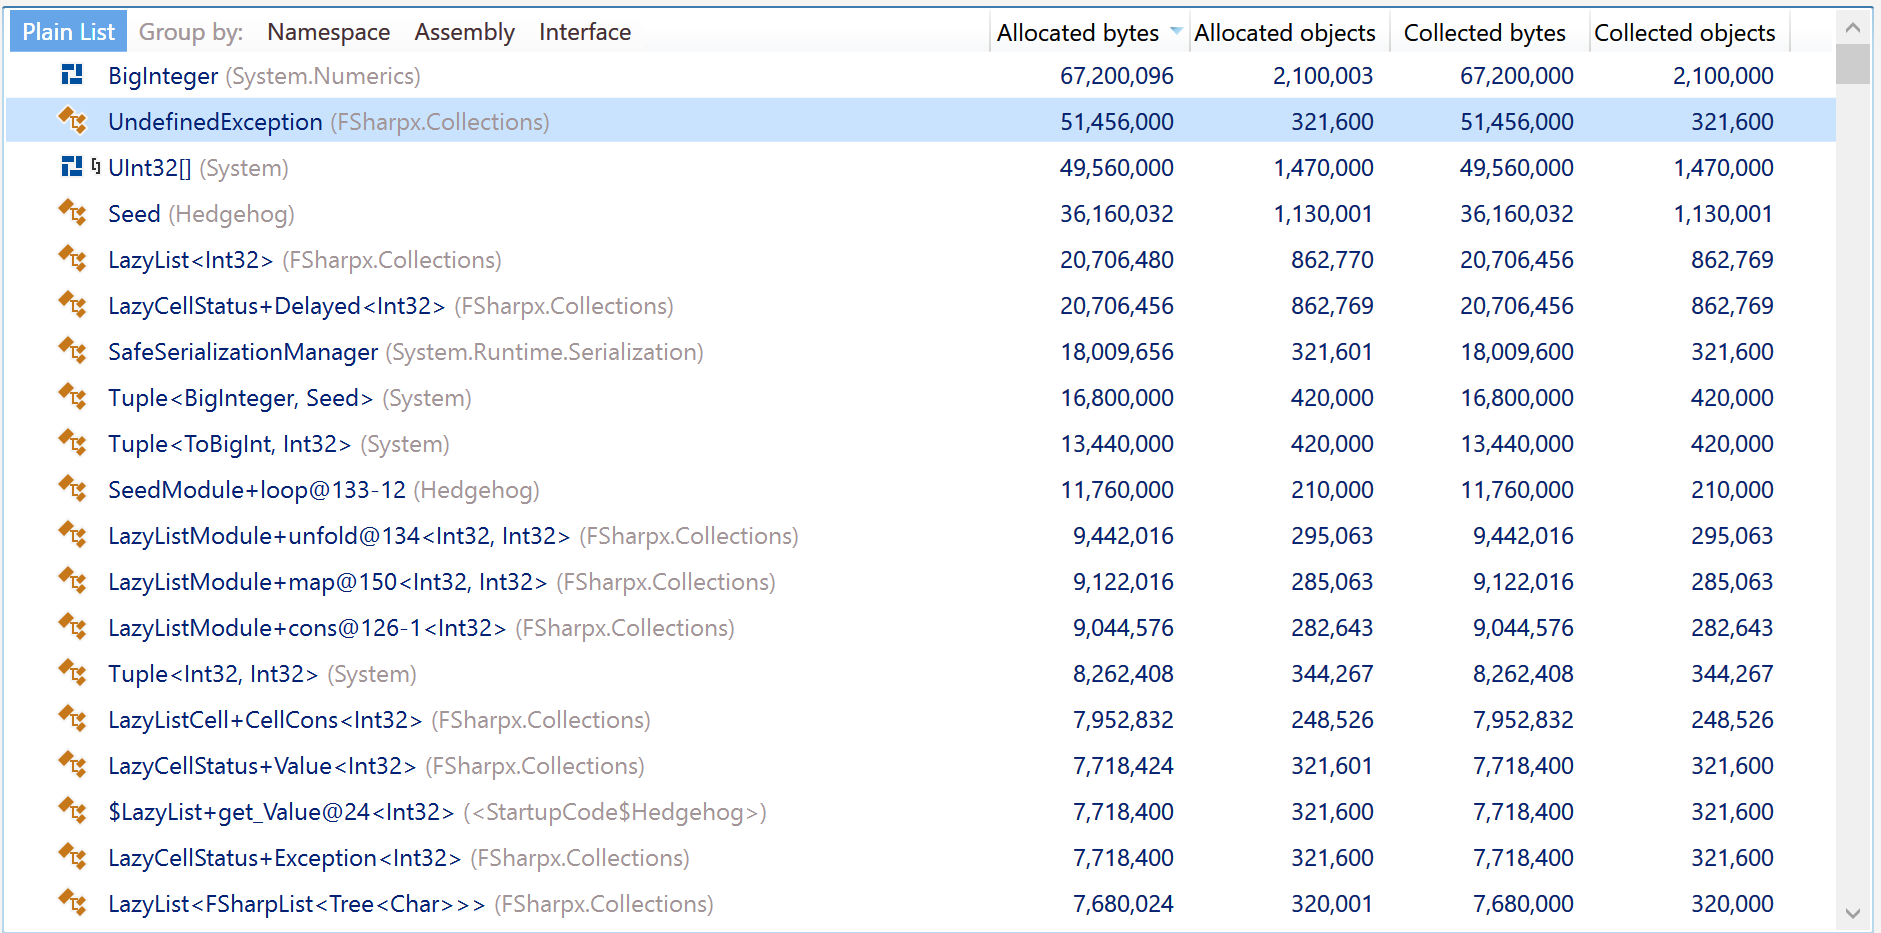
Yes, BitInteger should be removed if possible. Another scary thing - UndefinedException from FSharp.Collections package.
It seems that all the objects were retained by something, gen1 was growing all the time, then it switched to gen2 and stay there.
We can easily replace UndefinedException with something else as we're not explicitly relying on anything except FSharp.Core and the BCL.
FSharp.Collections is referenced as a source file and searching for UndefinedException yields only 2 results:
Find all "UndefinedException", Subfolders, Find Results 1, Entire Solution, ""
  \paket-files\fsprojects\FSharpx.Collections\src\FSharpx.Collections\LazyList.fs(14):exception UndefinedException
  \paket-files\fsprojects\FSharpx.Collections\src\FSharpx.Collections\LazyList.fs(27):x.status <- Exception UndefinedException;
  Matching lines: 2    Matching files: 1    Total files searched: 29
If we remove BigInteger, what should we use instead? I have a feeling that this particular perf hit comes from the handful of ad-hoc polymorphic things we need from FsControl...
@moodmosaic what happens if we edit the files in FSharpx.Collections? How does that work with updating them and so on?
These files are fetched by Paket directly from the FSharpx.Collections repo on GitHub.
If we should edit them, then we should get rid of these 3 lines in paket.dependencies and simply add those files to the project (similar to what we're doing with Numeric.fs from FsControl).
I'm trying to capture this testing in a script, I've come up with this (Requires F# 5 tooling for nuget references):
#r "nuget: Hedgehog"
#r "nuget: FsCheck"

module H =

  open Hedgehog

  let i = Gen.int32 (Range.constant -100 100)
  let check () = i |> Gen.sample 100 100000 |> Seq.iter ignore // Gen.sample is lazy now, we have to evaluate it manually.

module F =

  open FsCheck

  let i = Arb.generate<int>
  let check () = i |> Gen.sample 100 100000

#time "on"

H.check ()

#time "off"
#time "on"

F.check ()

#time "off"
Running this produces the following:
$ dotnet fsi --langversion:preview ./perf.fsx
Real: 00:00:00.341, CPU: 00:00:00.500, GC gen0: 35, gen1: 3, gen2: 1
Real: 00:00:00.061, CPU: 00:00:00.060, GC gen0: 6, gen1: 0, gen2: 0
I believe one reason for this disparity is our reliance on BigInt internally. We should probably switch to uint64 or int64, since they don't allocate on arithmetic operations. This is pure conjecture, and we'll need some profiling to see for sure.
After a quick switch to int64 for our internal "large integer" type, I increased the speed by about 33%:
$ dotnet fsi --langversion:preview ./perf.fsx
Real: 00:00:00.237, CPU: 00:00:00.320, GC gen0: 35, gen1: 2, gen2: 1
Real: 00:00:00.056, CPU: 00:00:00.060, GC gen0: 6, gen1: 0, gen2: 0
This is a PoC for BigInt being a bottleneck.
Instead of in a script with custom benchmarking work, can you do this in the Benchmark project with BenchmarkDotNet?
Yes, always use BenchmarkDotNet (or a similar tool, if it exists) for such benchmarking. 👍
Also, in the OP, the numbers I provided indicate that Hedgehog takes ~32 times longer than FsCheck. A speed-up of 33% is great, but there is still a difference of more than 3000%.
@TysonMN Instead of in a script with custom benchmarking work, can you do this in the Benchmark project with
BenchmarkDotNet? @cmeeren Yes, always use BenchmarkDotNet (or a similar tool, if it exists) for such benchmarking. 👍
The script wasn't meant to be authoritative, just something I could run repeatedly while tweaking things to suss out low hanging fruit.
Also, in the OP, the numbers I provided indicate that Hedgehog takes ~32 times longer than FsCheck. A speed-up of 33% is great, but there is still a difference of more than 3000%.
A journey of a thousand miles begins with a single step. My gut feeling tells me that we're probably allocating too much in hot paths, but we'll let the benchmarks be the guide 😉
And a journey by Zeno has infinitely many steps and essentially goes nowhere, so it is important to optimize things in decreasing order of ROI.