hedera-json-rpc-relay
 hedera-json-rpc-relay copied to clipboard
Published
20 hours ago •
 hashgraph
Save output of K6 Results into InfluxDb + Grafana
Problem
Currently we have a working suite of performance tests for hedera-json-rpc-relay, but the results of the tests are presented as a .md file so interpretation is limited.
Ideally we would like to have a graphical dashboard where we can have more insightful presentation and comparison of performance tests results.
Solution
- Provision an influxDB for k6
- Create npm task that use necessary options to save to influxdb and do an initial run.
- Add (Import) influxDB to Grafana server as a DataSource
- Create dashboard to show and present the results of the tests.
Recommended templates: This templates should be used as starting point and examples. https://grafana.com/grafana/dashboards/2587-k6-load-testing-results/ https://grafana.com/grafana/dashboards/10660-k6-load-testing-results/
K6 Doc on Export to InfluxDB: https://k6.io/docs/results-output/real-time/influxdb-grafana/
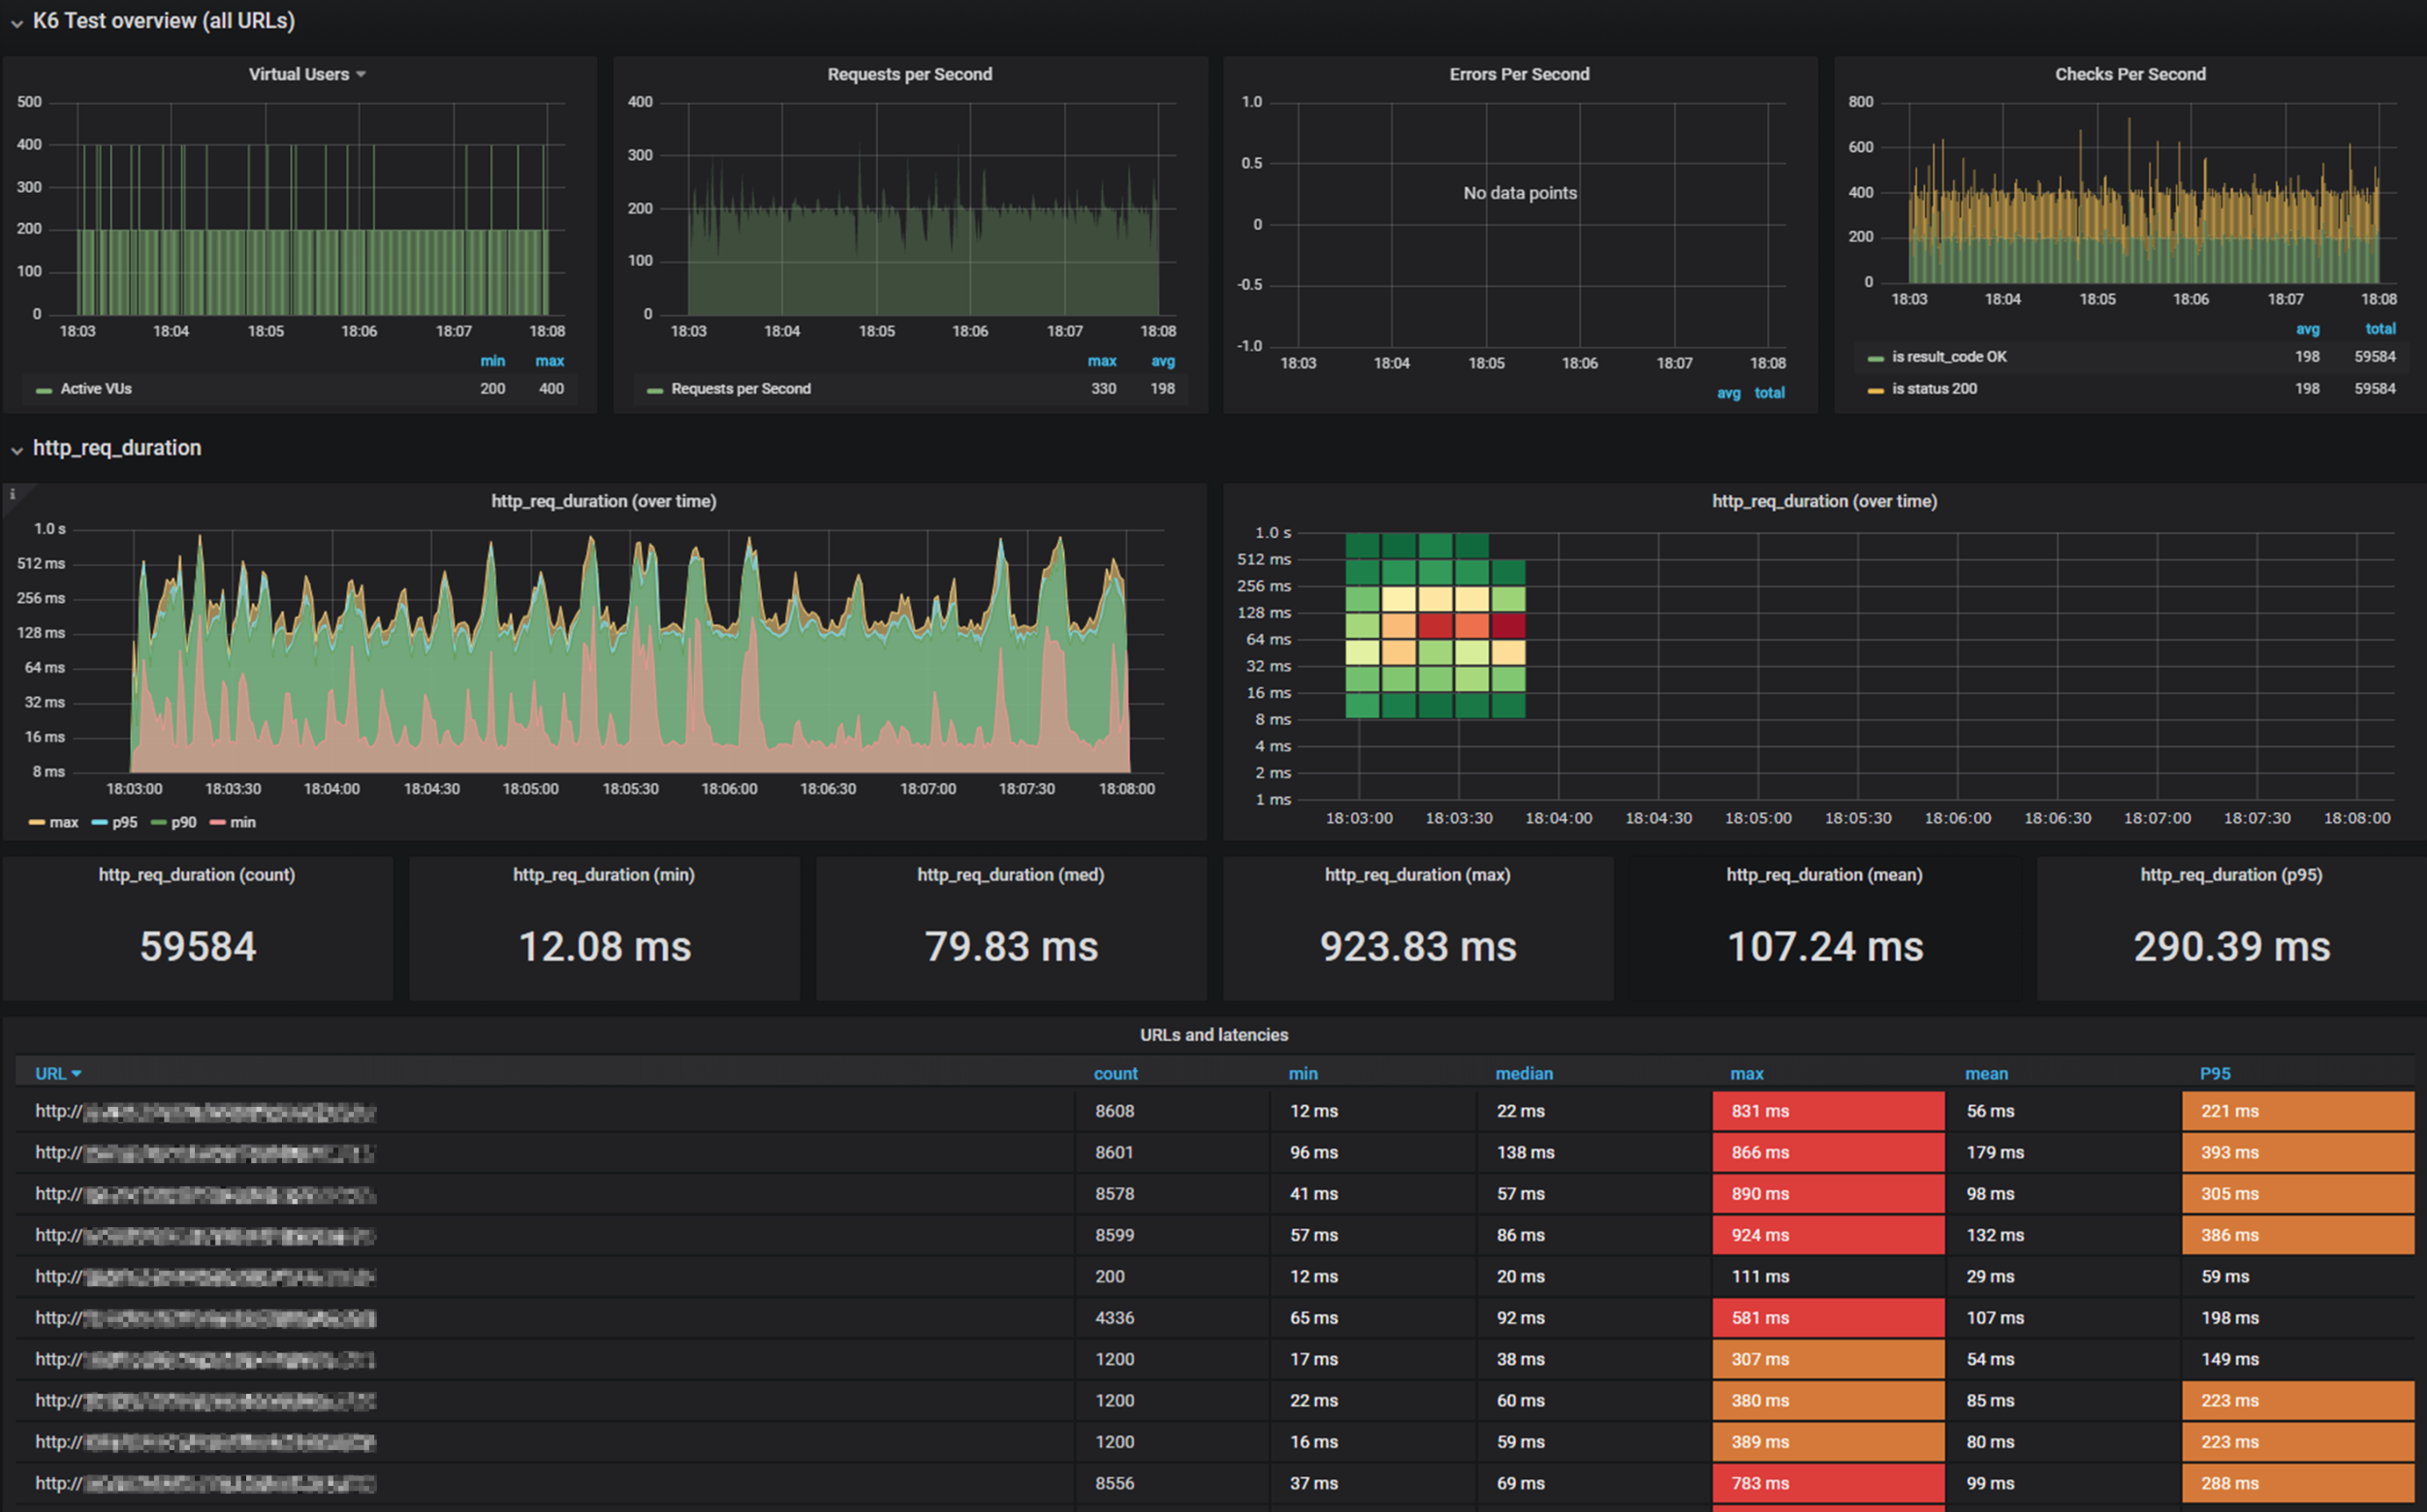
Example of desired output:
Alternatives
- use a GDrive Spreadsheet to generate some graphs.
- Continue to use the MD report storing it on a Notion page for reference.