plotnine
 plotnine copied to clipboard
Specify axis ordering for specific facet in multi-facet plot
Correct me if I am wrong, but it is not possible(?) to create a multi-facet plot with continuous facets where one of the facets reverses the x (y) axis in a particular facet. For example if I have:
df = pd.concat([
    pd.DataFrame({'x': [1, 2, 3, 4, 5, 6, 7, 8], 'level': [2, 4, 9, 25, 36, 49, 64], 'pane': 'left'}),
    pd.DataFrame({'x': [1, 2, 3, 4, 5, 6, 7, 8], 'level': [1, 3, 8, 24, 30, 40, 55], 'pane': 'right'})
])

(ggplot() +
    geom_area(aes(x='x', y='level', fill='pane'), data=df) +
    facet_grid(". ~ pane"))
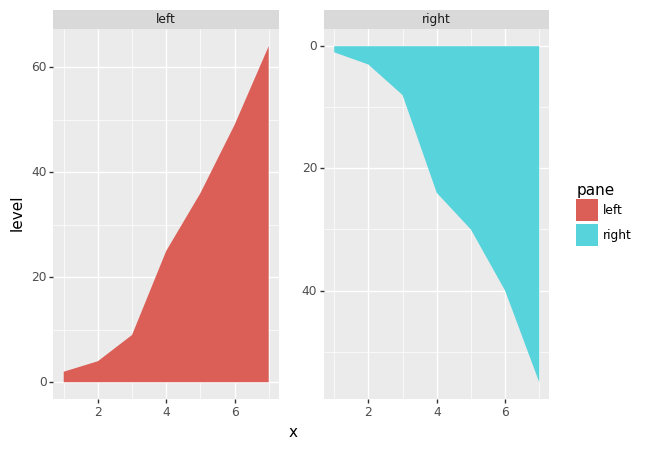
Supposing that I want the 'left' pane to be ordered from 8 downto 1 and the 'right' ordered from 1 to 8, is it possible to accomplish this in the same ggplot()?
You can do it in one of two ways.
- Drop into matplotlib and reverse the limits of the 2nd facet
- Create your own coordinate system that reverses the limits of the facet.
import pandas as pd
from plotnine import *

df = pd.concat([
    pd.DataFrame({'x': [1, 2, 3, 4, 5, 6, 7], 'level': [2, 4, 9, 25, 36, 49, 64], 'pane': 'left'}),
    pd.DataFrame({'x': [1, 2, 3, 4, 5, 6, 7], 'level': [1, 3, 8, 24, 30, 40, 55], 'pane': 'right'})
])

# Option 1
p = (ggplot()
 + geom_area(aes(x='x', y='level', fill='pane'), df)
 + facet_wrap("pane", scales='free_y')
 + theme(subplots_adjust={'wspace': 0.20})
)

fig = p.draw()
lax, rax = fig.get_axes()
rax.set_ylim(rax.get_ylim()[::-1])


# Option 2
def alt_sign_gen():
    while True:
        yield 1
        yield -1

alt_sign = alt_sign_gen()

class coord_alt_reverse(coord_cartesian):
        def setup_panel_params(self, scale_x, scale_y):
            r = super().setup_panel_params(scale_x, scale_y)
            sign = next(alt_sign)
            r.y.limits = r.y.limits[::sign]
            r.y.range = r.y.range[::sign]
            return r

(ggplot()
 + geom_area(aes(x='x', y='level', fill='pane'), df)
 + facet_wrap("pane", scales='free_y')
 + coord_alt_reverse()
 + theme(subplots_adjust={'wspace': 0.20})
)
Thanks! that is useful. I "solved" previously by rendering 2 ggplots and pasting together with a multi-panel figure. I wonder whether it makes sense to allow for for thematic or coordinate changes on a per facet basis as a feature in plotnine or perhaps this is too niche.
Yes it is niche, but the solution is to make it easy to combine multiple ggplots.