tempo
 tempo copied to clipboard
Discrepancy between tempo_ingester_live_traces metric and LIVE_TRACES_EXCEEDED warnings
Describe the bug
We've noticed LIVE_TRACES_EXCEEDED warnings in our distributor logs, and we wanted to make use of the tempo_ingester_live_traces metric to get a clearer picture of the number of live traces and possibly alert when we exceed the threshold. We've increased the threshold to 20,000 and we get messages like this.
LIVE_TRACES_EXCEEDED: max live traces exceeded for tenant single-tenant: per-user traces limit (local: 20000 global: 0 actual local: 20000) exceeded"
However when viewing historical metrics in Grafana for the same time period, we see we never hit the threshold.
Is the metric used for another purpose which could explain its discrepancy or is this a bug?
FYI: Seems like this metric also doesn't exist in the Grafana mixins dashboards.
To Reproduce Attempt to exceed LIVE_TRACES_EXCEEDED thresholds and see if the metric exceeded the threshold. I am running a "tempo_ingester_live_traces{}" query in Prometheus.
Expected behaviour We expected our metrics to show we've exceeded the threshold
Environment:
- Infrastructure: Kubernetes
- Deployment tool: helm
Additional Context
Umm I've noticed the metric comes from the ingester whereas the log message is from the distributor could be where this discrepancy is coming from. Would it make sense to also have the metric emitted by the distributor?
Reviewing the code, it looks like tempo_ingester_live_traces{} should be showing 20k if you are receiving that particular error message. There is some discrepancy between using the len() of a map and an atomic int32 to track the metric and the choice to refuse spans, but it seems like it should work.
Can you share a screenshot of this metric and indicate when you are receiving the error?
Umm I've noticed the metric comes from the ingester whereas the log message is from the distributor could be where this discrepancy is coming from. Would it make sense to also have the metric emitted by the distributor?
The distributor is just logging the error message it received from the ingester. The limit itself is meant purely to protect the ingester from a tenant surging it's traces/second and causing the ingester to OOM.
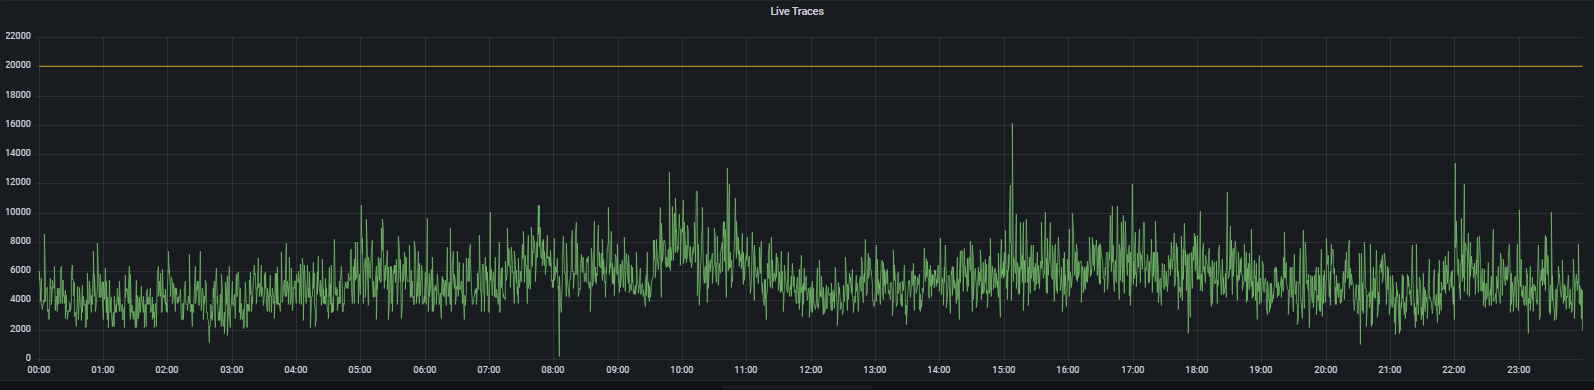
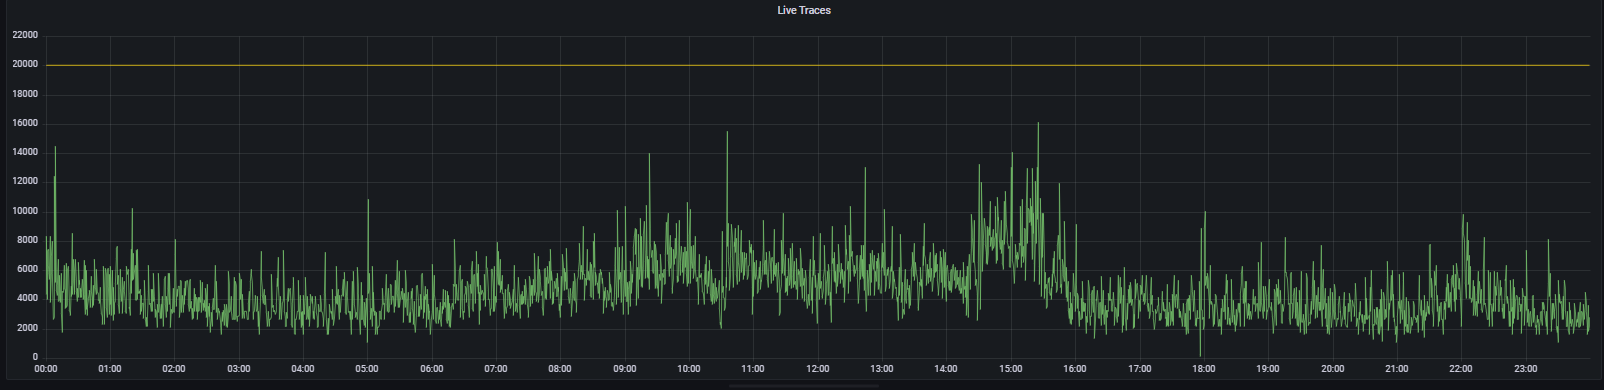
Order of images and times of when LIVE_TRACES_EXCEEDED was logged:
26th @ 08:04 - 13 hits 28th @ 10:03 - 3 hits 31th @ 10:44 - 11 hits
But yes, looking at the 26th and the 28th, I can see we refused some spans:
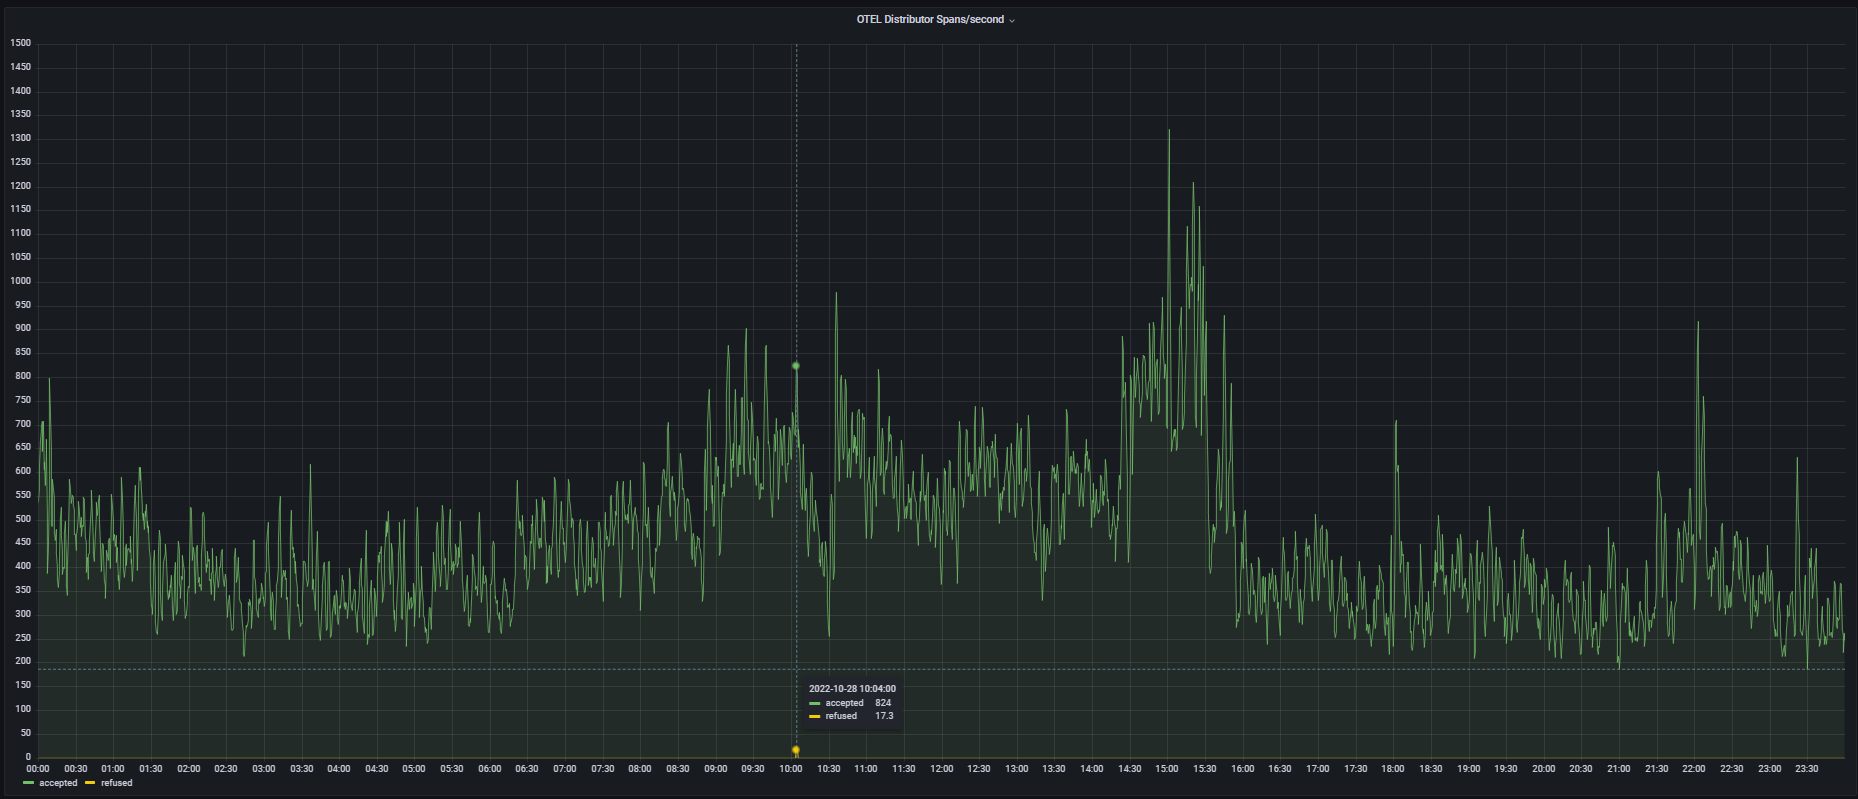
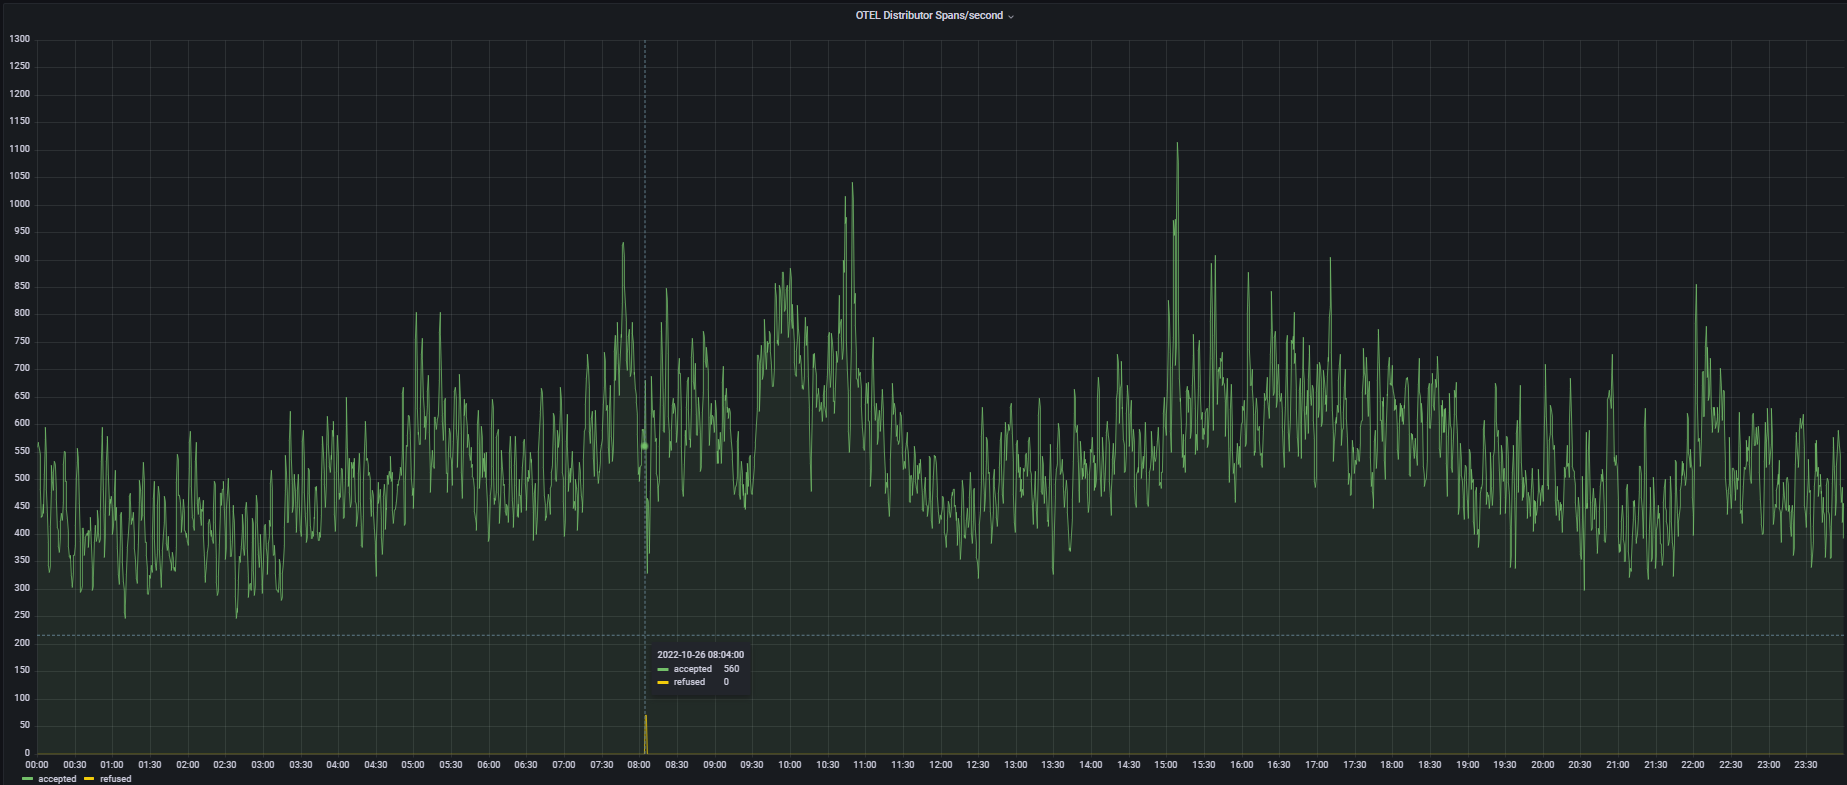
But the numbers don't line up? Or am I misinterpreting them?
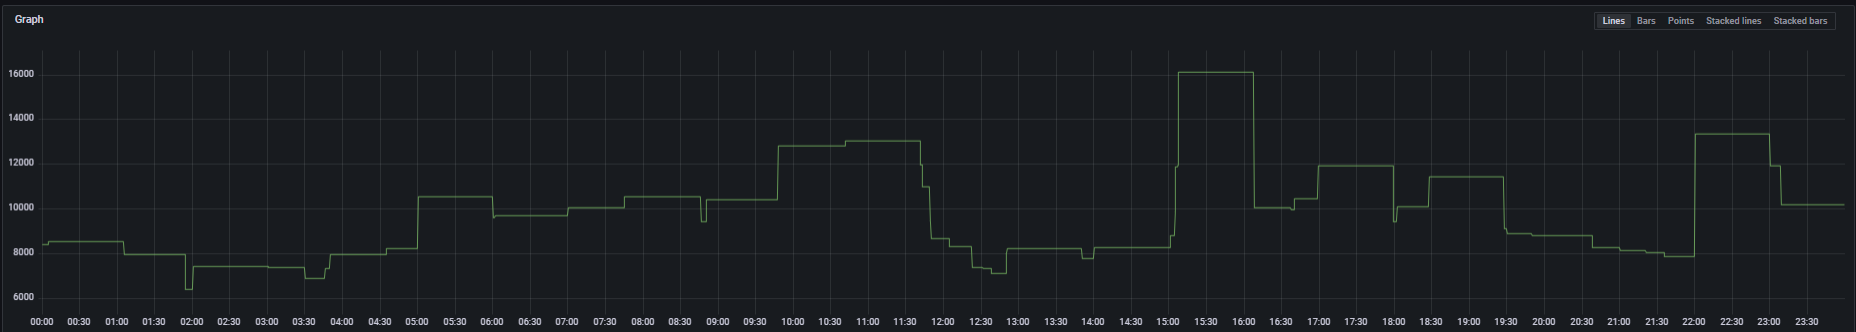
So of the times you posted, it does look like the final one (31th @ 10:44 - 11 hits) corresponds to a spike in ingester_live_traces_total{}. However the other two aren't showing similar spikes. I wonder if Grafana or Prometheus is dropping the incriminating data point at query time in order to draw the graphs effectively. Maybe try something like:
max_over_time(ingester_live_traces_total{}[1h])
This will answer more definitively if this metric ever got close to 20k at the time that spans were refused. While digging I've also noticed that we return FailedPrecondition for this error which means the sending client should drop it and not retry. I'm wondering if Unavailable or ResourceExhausted makes more sense as it will indicate that the sender should retry with backoff.
I wonder if Grafana or Prometheus is dropping the incriminating data point at query time in order to draw the graphs effectively. Maybe try something like:
I suspected that too, but when I zoom in to the time LIVE_TRACES_EXCEEDED was logged plus some extra hours, I don't see the metric reaching the threshold.
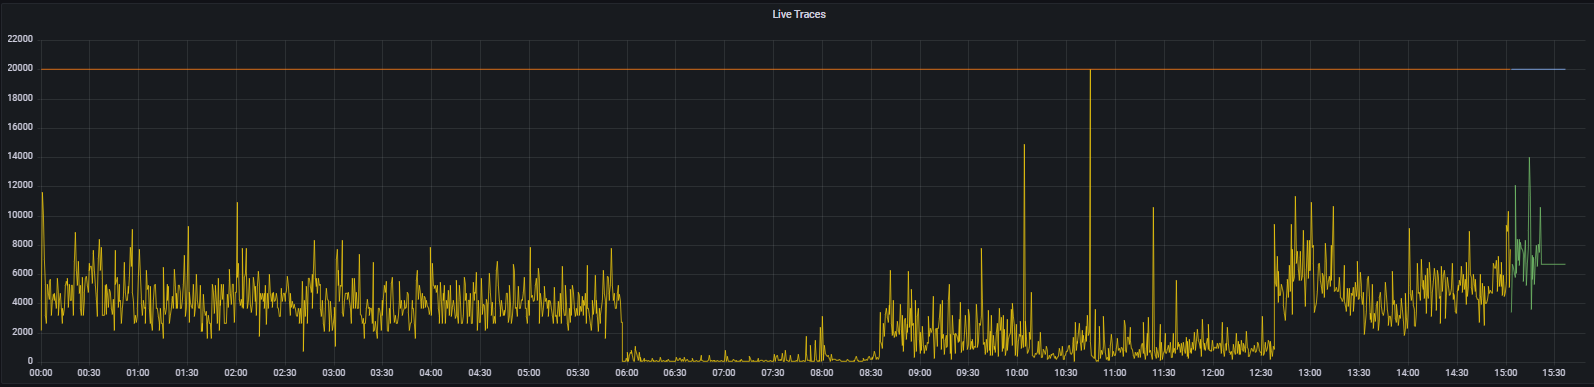
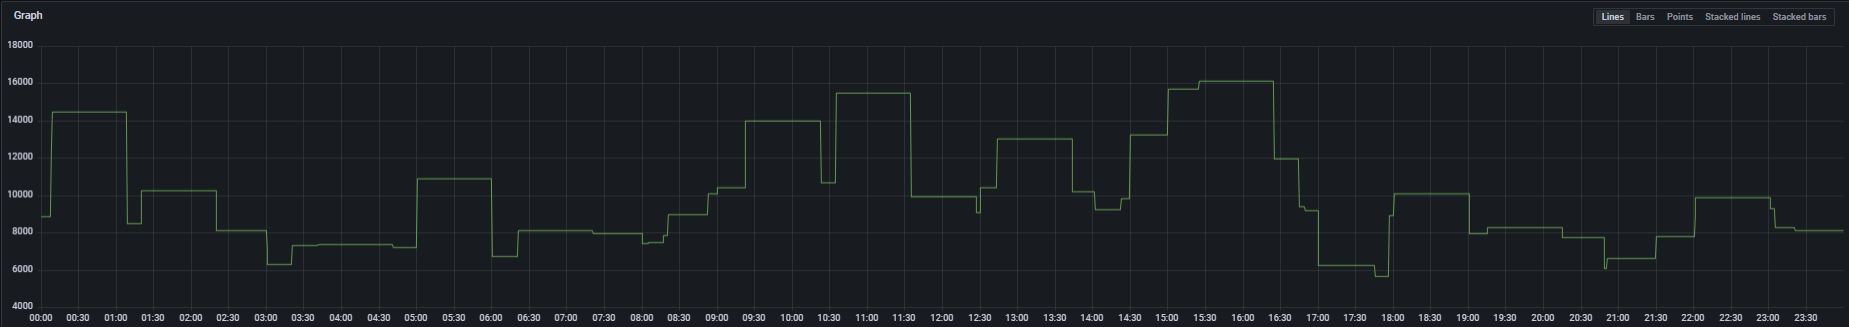
Here's max_over_time(tempo_ingester_live_traces{}[1h]) over 24 hours on the 26th and 28th, and I've included the 30th for good measure.
At the timestamps mentioned above: 26th measures 10535 28th measures 14003
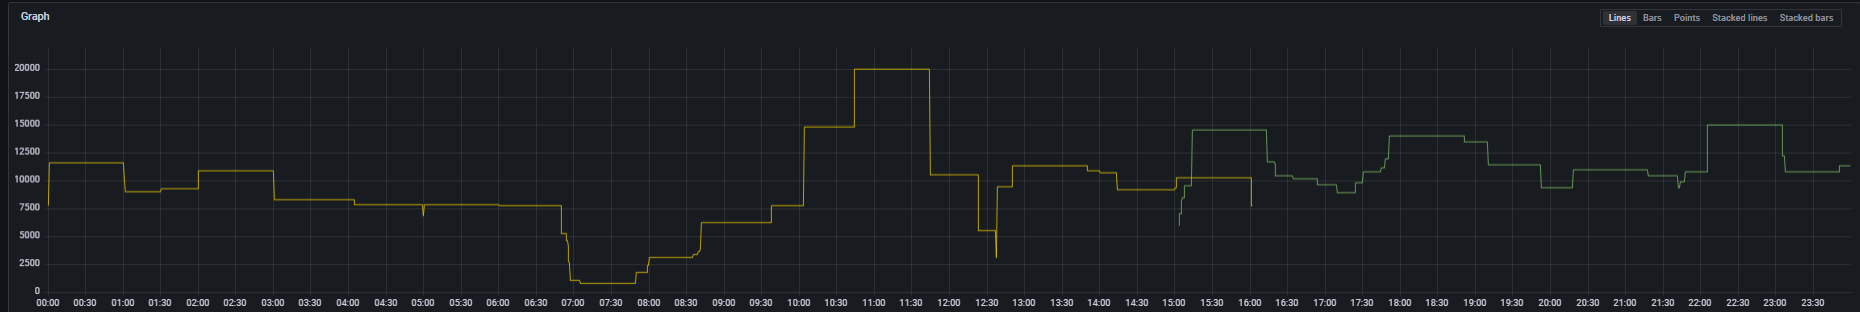
So it occurs to me that there is a chance, depending on your live traces flushed interval and prometheus scrape interval, to hit 20k but not actually see it on the metric. In fact, thinking through it, I'd say it's likely.
We set the live traces gauge metric before we flush live traces to the wal. It's possible to set this value multiple times between Prometheus scrape intervals. This would make the spike to 20k invisible.
To test this theory out you could increase your flush_check_period to be above your prometheus scrape interval to guarantee prometheus sees every gauge value. Although, given the issue you're seeing, my advice would be to lower this value to more effectively flush out live traces. Perhaps try 5s?
Looks like this has done the trick and the graphs reflect the events in the logs. Thanks so much.