tempo
 tempo copied to clipboard
python otel jaeger exporter,tempo query not data
python opentelemetry instrument install
pip install opentelemetry-sdk
pip install opentelemetry-distro
pip install opentelemetry-exporter-jaeger-proto-grpc
Testing python scripts:
import time

from opentelemetry import trace
from opentelemetry.exporter.jaeger.proto import grpc
from opentelemetry.sdk.trace import TracerProvider
from opentelemetry.sdk.trace.export import (BatchSpanProcessor,ConsoleSpanExporter)
from opentelemetry.sdk.resources import SERVICE_NAME, Resource

trace.set_tracer_provider(TracerProvider(
    resource=Resource.create({SERVICE_NAME: "my-helloworld-service"})
    ))
tracer = trace.get_tracer(__name__)

# Create a JaegerExporter to send spans with gRPC
# If there is no encryption or authentication set `insecure` to True
# If server has authentication with SSL/TLS you can set the
# parameter credentials=ChannelCredentials(...) or the environment variable
# `EXPORTER_JAEGER_CERTIFICATE` with file containing creds.

jaeger_exporter = grpc.JaegerExporter(
    collector_endpoint="localhost:14250",
    insecure=True,
)

trace.get_tracer_provider().add_span_processor(
    BatchSpanProcessor(ConsoleSpanExporter())
)

trace.get_tracer_provider().add_span_processor(
        BatchSpanProcessor(jaeger_exporter)
        )

# create some spans for testing
with tracer.start_as_current_span("foo") as foo:
    time.sleep(0.1)
    foo.set_attribute("my_atribbute", True)
    foo.add_event("event in foo", {"name": "foo1"})
    with tracer.start_as_current_span(
        "bar", links=[trace.Link(foo.get_span_context())]
    ) as bar:
        time.sleep(0.2)
        bar.set_attribute("speed", 100.0)

        with tracer.start_as_current_span("baz") as baz:
            time.sleep(0.3)
            baz.set_attribute("name", "mauricio")

        time.sleep(0.2)

    time.sleep(0.1)
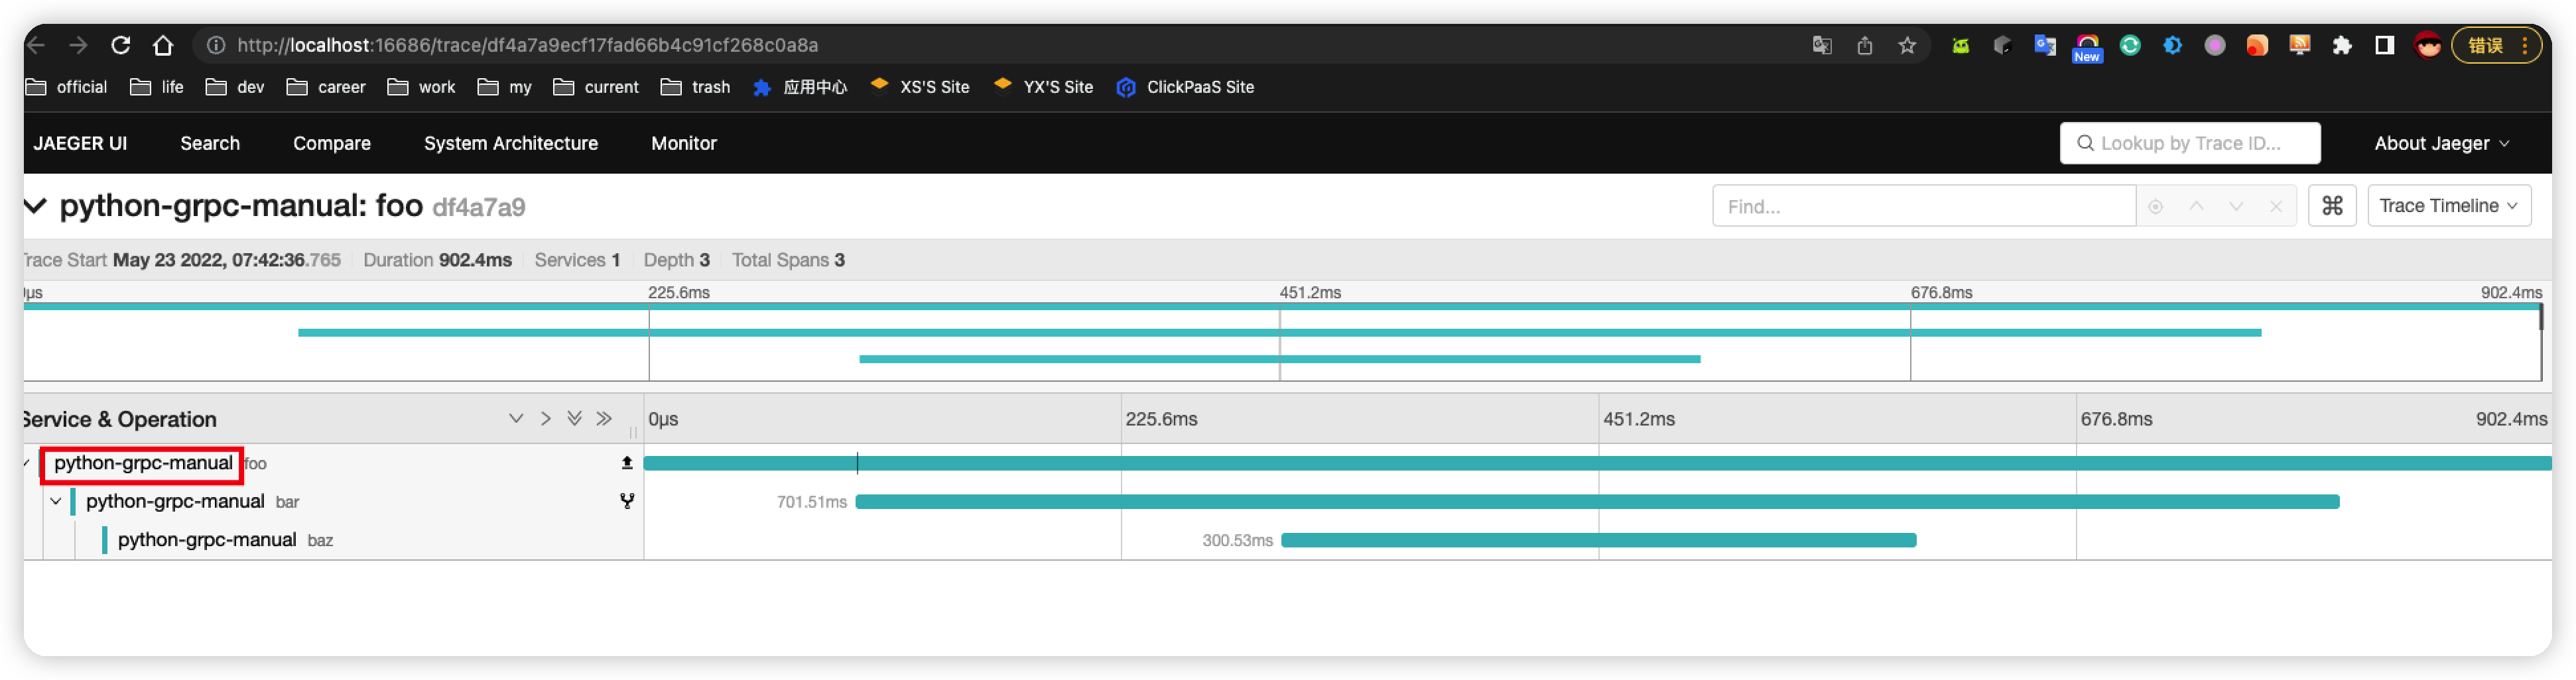
Exporting to Jaeger is normal and can be queried
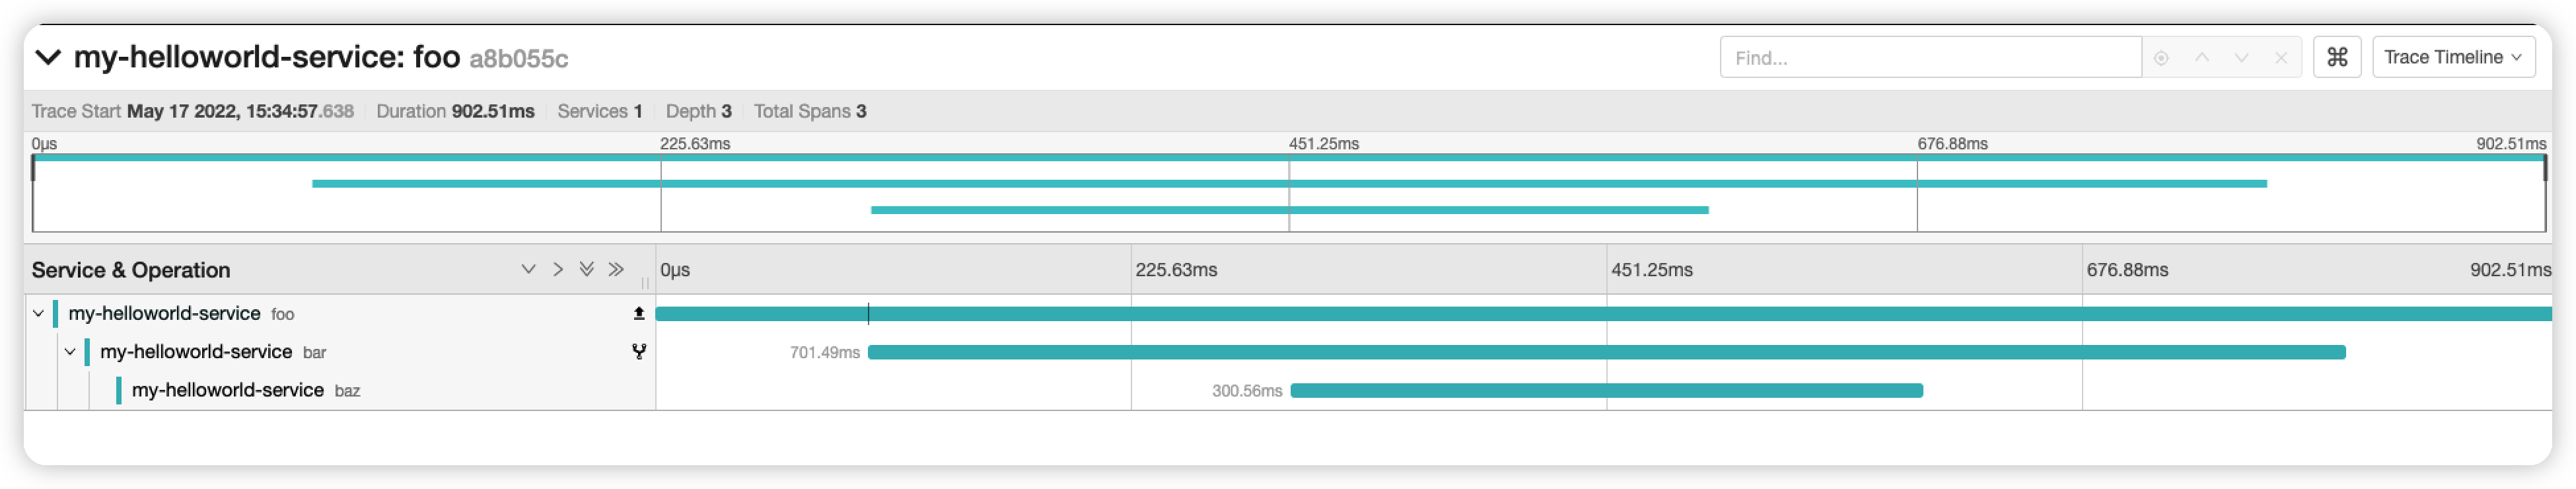
Exports to Tempo cannot be queried,There was no hint

grafana tempo query result data:
{
    "results": {
        "B": {
            "frames": [
                {
                    "schema": {
                        "name": "Trace",
                        "refId": "B",
                        "meta": {
                            "preferredVisualisationType": "trace"
                        },
                        "fields": [
                            {
                                "name": "traceID",
                                "type": "string",
                                "typeInfo": {
                                    "frame": "string"
                                }
                            },
                            {
                                "name": "spanID",
                                "type": "string",
                                "typeInfo": {
                                    "frame": "string"
                                }
                            },
                            {
                                "name": "parentSpanID",
                                "type": "string",
                                "typeInfo": {
                                    "frame": "string"
                                }
                            },
                            {
                                "name": "operationName",
                                "type": "string",
                                "typeInfo": {
                                    "frame": "string"
                                }
                            },
                            {
                                "name": "serviceName",
                                "type": "string",
                                "typeInfo": {
                                    "frame": "string"
                                }
                            },
                            {
                                "name": "serviceTags",
                                "type": "string",
                                "typeInfo": {
                                    "frame": "string"
                                }
                            },
                            {
                                "name": "startTime",
                                "type": "number",
                                "typeInfo": {
                                    "frame": "float64"
                                }
                            },
                            {
                                "name": "duration",
                                "type": "number",
                                "typeInfo": {
                                    "frame": "float64"
                                }
                            },
                            {
                                "name": "logs",
                                "type": "string",
                                "typeInfo": {
                                    "frame": "string"
                                }
                            },
                            {
                                "name": "references",
                                "type": "string",
                                "typeInfo": {
                                    "frame": "string"
                                }
                            },
                            {
                                "name": "tags",
                                "type": "string",
                                "typeInfo": {
                                    "frame": "string"
                                }
                            }
                        ]
                    },
                    "data": {
                        "values": [
                            [],
                            [],
                            [],
                            [],
                            [],
                            [],
                            [],
                            [],
                            [],
                            [],
                            []
                        ]
                    }
                }
            ]
        }
    }
}
This code is using Jaeger GRPC which is supported by Tempo but not turned on by default. This config turns on all ingestion protocols:
https://github.com/grafana/tempo/blob/4e0f12da3cd2d665e5933bb402b06ca66efe5d7a/example/docker-compose/local/tempo-local.yaml#L6-L19
You may also want to use the log_received_traces configuration option under distributor:
https://grafana.com/docs/tempo/latest/configuration/#distributor
This option should not be used in production but is a good way to confirm that Tempo is receiving traces.
This code is using Jaeger GRPC which is supported by Tempo but not turned on by default. This config turns on all ingestion protocols:
https://github.com/grafana/tempo/blob/4e0f12da3cd2d665e5933bb402b06ca66efe5d7a/example/docker-compose/local/tempo-local.yaml#L6-L19
You may also want to use the
log_received_tracesconfiguration option under distributor:https://grafana.com/docs/tempo/latest/configuration/#distributor
This option should not be used in production but is a good way to confirm that Tempo is receiving traces.
However, there is no problem with otel javaagent use, so why is there a problem with python client export?
However, there is no problem with otel javaagent use, so why is there a problem with python client export?
Likely they are using different protocols. OTel Java agent is likely using OTel GRPC which Tempo consumes in its default configuration. The python snippet you showed is using Jaeger GRPC.
This code is using Jaeger GRPC which is supported by Tempo but not turned on by default. This config turns on all ingestion protocols:
https://github.com/grafana/tempo/blob/4e0f12da3cd2d665e5933bb402b06ca66efe5d7a/example/docker-compose/local/tempo-local.yaml#L6-L19
You may also want to use the
log_received_tracesconfiguration option under distributor:https://grafana.com/docs/tempo/latest/configuration/#distributor
This option should not be used in production but is a good way to confirm that Tempo is receiving traces.
However, there is no problem with otel javaagent use, so why is there a problem with python client export?
Likely they are using different protocols. OTel Java agent is likely using OTel GRPC which Tempo consumes in its default configuration. The python snippet you showed is using Jaeger GRPC.
The OTel javaagent export method also specifies the port number 14250 used by jaeger.
However, there is no problem with otel javaagent use, so why is there a problem with python client export?
Likely they are using different protocols. OTel Java agent is likely using OTel GRPC which Tempo consumes in its default configuration. The python snippet you showed is using Jaeger GRPC.
I adjusted the tempo.yaml configuration and tried again, but still could not query traceId Span data. The current phenomenon is that traceId is present in TEMPO, but Span data is empty. You can use the configuration I provided below to test it out.
Python OTel example:
First installation
pip install opentelemetry-sdk
pip install opentelemetry-distro
pip install opentelemetry-exporter-jaeger-proto-grpc
jaeger_exporter_example_grpc.py
import time

from opentelemetry import trace
from opentelemetry.exporter.jaeger.proto.grpc import JaegerExporter
from opentelemetry.sdk.trace import TracerProvider
from opentelemetry.sdk.trace.export import (BatchSpanProcessor,ConsoleSpanExporter)
from opentelemetry.sdk.resources import SERVICE_NAME, Resource

trace.set_tracer_provider(TracerProvider(
    resource=Resource.create({SERVICE_NAME: "my-helloworld-service"})
    ))
tracer = trace.get_tracer(__name__)

jaeger_exporter = JaegerExporter(
     collector_endpoint="your_backend_ip:14250",
    insecure=True,
)

trace.get_tracer_provider().add_span_processor(
    BatchSpanProcessor(ConsoleSpanExporter())
)

trace.get_tracer_provider().add_span_processor(
    BatchSpanProcessor(jaeger_exporter)
)

# create some spans for testing
with tracer.start_as_current_span("foo") as foo:
    time.sleep(0.1)
    foo.set_attribute("my_atribbute", True)
    foo.add_event("event in foo", {"name": "foo1"})
    with tracer.start_as_current_span(
        "bar", links=[trace.Link(foo.get_span_context())]
    ) as bar:
        time.sleep(0.2)
        bar.set_attribute("speed", 100.0)

        with tracer.start_as_current_span("baz") as baz:
            time.sleep(0.3)
            baz.set_attribute("name", "mauricio")

        time.sleep(0.2)

    time.sleep(0.1)
python run
python jaeger_exporter_example_grpc.py
docker-compose.yaml
tempo:
    image: grafana/tempo:1.4.1
    command: ["-config.file=/etc/tempo.yaml"]
    volumes:
      - ./tempo.yaml:/etc/tempo.yaml
      - ./data:/tmp/tempo
    #restart: unless-stopped
    ports:
      - "14250:14250"  # Jaeger - GRPC
      - "3200:3200"    # Tempo
grafana:
    image: grafana/grafana:8.5.0
    user: "0"
    ports:
      - "3000:3000"
    environment:
      - GF_AUTH_DISABLE_LOGIN_FORM=true
      - GF_AUTH_ANONYMOUS_ENABLED=true
      - GF_AUTH_ANONYMOUS_ORG_NAME=Main Org.
      - GF_AUTH_ANONYMOUS_ORG_ROLE=Admin
      - GF_USERS_ALLOW_SIGN_UP=false
        #- GF_AUTH_ANONYMOUS_ENABLED=true
        #- GF_AUTH_ORG_ROLE=Editor
        #- GF_AUTH_DISABLE_LOGIN_FORM=true
        #- GF_AUTH_ANONYMOUS_ORG_NAME="Main Org."
    volumes:
      - ./datasources:/etc/grafana/provisioning/datasources
      - ./dashboards:/etc/grafana/provisioning/dashboards
      - ./grafana:/var/lib/grafana
tempo.yaml
auth_enabled: false

server:
  http_listen_port: 3200

distributor:
  receivers:                           # this configuration will listen on all ports and protocols that tempo is capable of.
    jaeger:                            # the receives all come from the OpenTelemetry collector.  more configuration information can
      protocols:                       # be found there: https://github.com/open-telemetry/opentelemetry-collector/tree/master/receiver
        grpc:                          # for a production deployment you should only enable the receivers you need!
  log_received_traces: true

ingester:
  trace_idle_period: 10s               # the length of time after a trace has not received spans to consider it complete and flush it
  #traces_per_block: 1_000_000
  max_block_duration: 5m               #   this much time passes

compactor:
  compaction:
    compaction_window: 1h              # blocks in this time window will be compacted together
    max_compaction_objects: 1000000    # maximum size of compacted blocks
    block_retention: 1h
    compacted_block_retention: 10m

storage:
  trace:
    backend: local                     # backend configuration to use
    wal:
      path: /tmp/tempo/wal            # where to store the the wal locally
      #bloom_filter_false_positive: .05 # bloom filter false positive rate.  lower values create larger filters but fewer false positives
      #index_downsample: 10             # number of traces per index record
    local:
      path: /tmp/tempo/blocks
    pool:
      max_workers: 100                 # the worker pool mainly drives querying, but is also used for polling the blocklist
      queue_depth: 10000
jaeger backend(Tempo and Jaeger were tested alternately)
docker run -d --name jaeger \
  -e COLLECTOR_ZIPKIN_HOST_PORT=:9411 \
  -p 5775:5775/udp \
  -p 6831:6831/udp \
  -p 6832:6832/udp \
  -p 5778:5778 \
  -p 16686:16686 \
  -p 14250:14250 \
  -p 14268:14268 \
  -p 14269:14269 \
  -p 9411:9411 \
  jaegertracing/all-in-one:1.34
The Jaeger Thirft Protocol tried it and it worked. GRPC is faulty.
Python Thirft Example
First installation
pip install opentelemetry-sdk
pip install opentelemetry-distro
pip install opentelemetry-exporter-jaeger-thrift
jaeger_exporter_example_thrift.py
import time

from opentelemetry import trace
from opentelemetry.exporter.jaeger import thrift
from opentelemetry.sdk.trace import TracerProvider
from opentelemetry.sdk.trace.export import (BatchSpanProcessor,ConsoleSpanExporter)
from opentelemetry.sdk.resources import SERVICE_NAME, Resource

trace.set_tracer_provider(TracerProvider(
    resource=Resource.create({SERVICE_NAME: "my-helloworld-service"})
    ))
tracer = trace.get_tracer(__name__)

jaeger_exporter = thrift.JaegerExporter(
    collector_endpoint="http://your_backend_ip:14268/api/traces?format=jaeger.thrift",
)

trace.get_tracer_provider().add_span_processor(
    BatchSpanProcessor(ConsoleSpanExporter())
)

trace.get_tracer_provider().add_span_processor(
    BatchSpanProcessor(jaeger_exporter)
)

# create some spans for testing
with tracer.start_as_current_span("foo") as foo:
    time.sleep(0.1)
    foo.set_attribute("my_atribbute", True)
    foo.add_event("event in foo", {"name": "foo1"})
    with tracer.start_as_current_span(
        "bar", links=[trace.Link(foo.get_span_context())]
    ) as bar:
        time.sleep(0.2)
        bar.set_attribute("speed", 100.0)

        with tracer.start_as_current_span("baz") as baz:
            time.sleep(0.3)
            baz.set_attribute("name", "mauricio")

        time.sleep(0.2)

    time.sleep(0.1)
python run
python jaeger_exporter_example_thrift.py
I see you've enabled log_received_traces are you seeing the expected traces and span ids logged here? what do you mean by "Span data is empty"?
I see you've enabled
log_received_tracesare you seeing the expected traces and span ids logged here? what do you mean by "Span data is empty"?
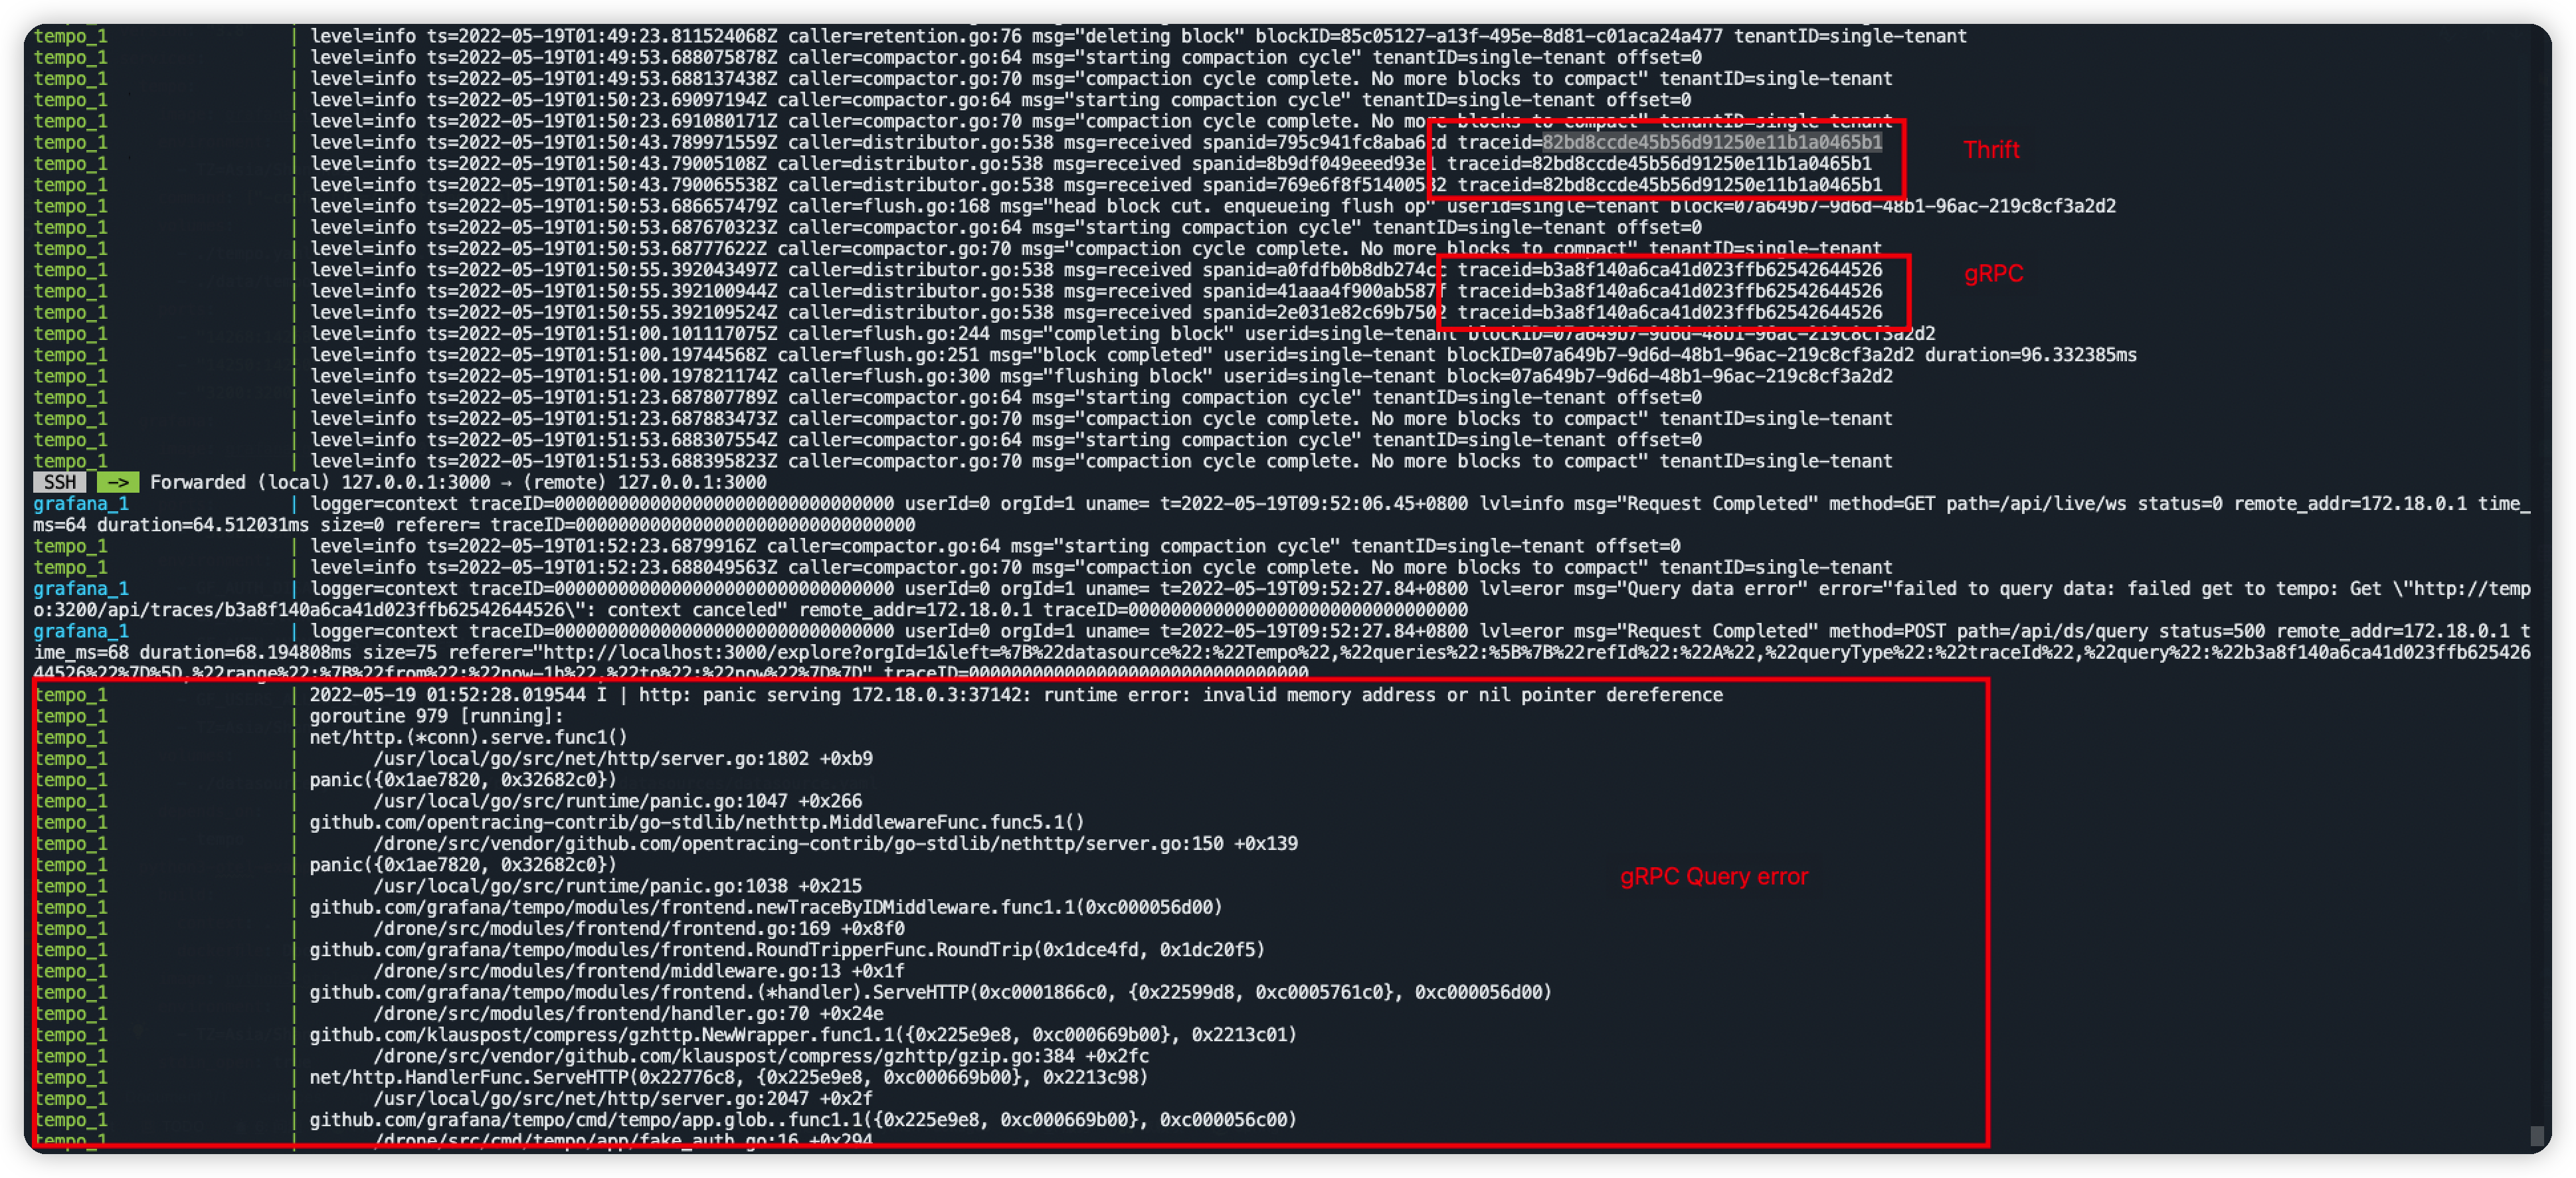
I don't think I've ever seen that panic before. How often does it occur? What version of Tempo are you running?
Testing this some more with Zach, the trace is formatted incorrectly. If you query Tempo directly and upload the trace as JSON to the 'JSON File' tab in explore, it errors with JSON is not valid OpenTelemetry format: TypeError: e.attributes is not iterable. The frontend should be reporting an error when querying for the trace or better handle the attributes
Testing this some more with Zach, the trace is formatted incorrectly. If you query Tempo directly and upload the trace as JSON to the 'JSON File' tab in explore, it errors with
JSON is not valid OpenTelemetry format: TypeError: e.attributes is not iterable. The frontend should be reporting an error when querying for the trace or better handle the attributes
No, because sending directly to the Jaeger back end via the gRPC protocol is fine.
@joe-elliott @connorlindsey
[email protected]:xs-samples/opentelemetry-samples.git
You can use this sample repository test, which includes the Tempo, Jaeger back end
I've spent a little time with the sample code and testing it out locally. It looks to me like Tempo is doing the right thing here. The first point at which we receive the trace bytes from the Jaeger protocol, the Resource is empty, which is relied upon by Grafana to get the service name attribute and render the trace. In the Python code, I would expect this to get populated, given the following.
trace.set_tracer_provider(
    TracerProvider(resource=Resource.create({SERVICE_NAME: "my-helloworld-service"}))
)
If I output the data structure that we receive from that trace push using spew.Dump, the Resource is empty.
(pdata.Traces) {
 orig: (*v1.TracesData)(0xc000b963a8)((PANIC=reflect.Value.Interface: cannot return value obtained from unexported field or method){
  ResourceSpans: ([]*v1.ResourceSpans) (len=1 cap=1) {
   (*v1.ResourceSpans)(0xc0006fabe0)((PANIC=reflect.Value.Interface: cannot return value obtained from unexported field or method){
    Resource: (v1.Resource) ,
    InstrumentationLibrarySpans: ([]*v1.InstrumentationLibrarySpans) (len=1 cap=1) {
     (*v1.InstrumentationLibrarySpans)(0xc0006fac80)((PANIC=reflect.Value.Interface: cannot return value obtained from unexported field or method){
      InstrumentationLibrary: (v1.InstrumentationLibrary) name:"__main__" ,
      Spans: ([]*v1.Span) (len=3 cap=4) {
       (*v1.Span)(0xc00069d860)((PANIC=reflect.Value.Interface: cannot return value obtained from unexported field or method){
...
Since Grafana relies on the Resource being populated to extract the service name, that explains why this is currently not showing up when we query for a trace sent with this code from Grafana.
However, I'm not sure what the Python code should be doing. It does look like this code is converting from opentelemetry to jaeger, which could be the source of some issue.
https://github.com/open-telemetry/opentelemetry-python/blob/main/exporter/opentelemetry-exporter-jaeger-proto-grpc/src/opentelemetry/exporter/jaeger/proto/grpc/init.py#L162
More generally, I'm wondering if you are in a position to emit OTLP directly, rather than having the client perform a conversion. This might result in a smoother experience with fewer layers of translation between. As you mention that thrift is also working for you, this seems like a client-side implementation that might be hard to troubleshoot.
@zalegrala
https://github.com/xs-samples/opentelemetry-samples
You can use this example which has exported to Jaeger gRPC which Jaeger normally receives. But exporting to Tempo in the same way is not normal.
I don't think this shows that there is a problem with the Python export, and that the problem is Tempo. The reason is that exporting to Jaeger using gRPC is normal.
I spent a little time with this last week, let me see if I can summarize.
In doing a little research, I ran into a couple documents which describe what the SDKs for opentelemetry should be doing in order to meet the specifications.
https://github.com/open-telemetry/opentelemetry-specification/blob/main/specification/resource/sdk.md#sdk-provided-resource-attributes https://github.com/open-telemetry/opentelemetry-specification/blob/main/specification/resource/semantic_conventions/README.md#semantic-attributes-with-sdk-provided-default-value
This says to me that each time we receive a batch of spans, we should also be receiving a resource that contains the service name. It looks like some of the logic in the python agent attempts to use the first span service name if one is not already set on the resource.
https://github.com/open-telemetry/opentelemetry-python/blob/main/exporter/opentelemetry-exporter-jaeger-proto-grpc/src/opentelemetry/exporter/jaeger/proto/grpc/init.py#L158-L161
However, that code isn't used by the python example that you mentioned earlier. It is this line of code that is responsible for sending the spans, and digging further you can see that the resource is never mentioned.
https://github.com/open-telemetry/opentelemetry-python/blob/main/exporter/opentelemetry-exporter-jaeger-proto-grpc/src/opentelemetry/exporter/jaeger/proto/grpc/init.py#L167
If that line is changed to the following, then the resource shows up with the service name and Grafana renders is correctly.
batch = model_pb2.Batch(spans=jaeger_spans, process=jaeger_spans[0].process)
I assume that the reason Jaeger does represent the trace is that it may not care to be opentelemetry compatible, and may not need to the process in the same way that Grafana does.
So I believe what is required is a change to the Python agent to adhere to the OTEL spec as defined in those links above.
Let me know if I'm mistaken about any of that, but based on the reading and debugging, I believe that is the right path forward. I'm happy enough to file an issue on the Python agent repo unless that is something that you'd like to run with.
This issue has been automatically marked as stale because it has not had any activity in the past 60 days. The next time this stale check runs, the stale label will be removed if there is new activity. The issue will be closed after 15 days if there is no new activity. Please apply keepalive label to exempt this Issue.