grafana
 grafana copied to clipboard
Variable replacement breaks once an expression is added
What happened: Using the latest influxdb data source (Flux QL), I can add queries using dashboard variables and it all works as expected, but once I add an expression in the query chain, it breaks. With my current use case, I can easily work around the issue by doing the desired operation elsewhere, but just raising for awareness.
What you expected to happen:
Expressions shouldn't impact variable replacement in queries.
How to reproduce it (as minimally and precisely as possible):
A =
from(bucket: "A Bucket")
  |> range(start: v.timeRangeStart, stop: v.timeRangeStop)
  |> truncateTimeColumn(unit: 1m)
  |> filter(fn: (r) => r["_measurement"] == "ConsumedWriteCapacityUnits")
  |> filter(fn: (r) => r["TableName"] == "IoT_Thing_History_A" or r["TableName"] == "IoT_Thing_History_B")
  |> filter(fn: (r) => r["_field"] == "Sum")
  |> filter(fn: (r) => contains(value: r["account"], set: [${account_id:doublequote}]))
  |> aggregateWindow(every: 1m, fn: last, createEmpty: false)
  |> aggregateWindow(every: 1m, fn: sum, createEmpty: true)
  |> group(columns: ["_field"])
  |> aggregateWindow(every: v.windowPeriod, fn: sum, createEmpty: false)
  |> yield(name: "sum")
B =
import "math"
from(bucket: "A Bucket")
  |> range(start: v.timeRangeStart, stop: v.timeRangeStop)
  |> truncateTimeColumn(unit: 1m)
  |> filter(fn: (r) => r["_measurement"] == "MqttDataTransferSize")
  |> filter(fn: (r) => r["_field"] == "SampleCount" or r["_field"] == "Sum")
  |> filter(fn: (r) => contains(value: r["account"], set: [${account_id:doublequote}]))
  |> pivot(rowKey: ["_time"], columnKey: ["_field"], valueColumn: "_value")
  |> map(fn: (r) => ({r with _value: math.mMax(x: r.SampleCount, y: math.ceil(x: r.Sum / 1000.0))}))
  |> aggregateWindow(every: 1m, fn: last, createEmpty: false)
  |> aggregateWindow(every: 1m, fn: sum, createEmpty: true)
  |> group(columns: ["_field"])
  |> aggregateWindow(every: v.windowPeriod, fn: sum, createEmpty: false)
  |> yield(name: "sum")
Note the
|> filter(fn: (r) => contains(value: r["account"], set: [${account_id:doublequote}]))lines in each query using a dashboard variableaccount_id
At this point, it works as expected and the data is properly retrieved from the data-source. But if I try to add an expression:
C=
Operation: Math
Expression: $B - $A
The query breaks.
expression request error: failed to execute query A: invalid: compilation failed: error @7:60-7:61: invalid expression: invalid token for primary expression: ILLEGAL

error @7:62-7:72: expected COMMA, got ILLEGAL ($) at 7:60
Anything else we need to know?:
Environment:
- Grafana version: v8.4.3 (b7d2911cac)
- Data source type & version: influx-db (version? core?)
- OS Grafana is installed on: Ubuntu 20.04.3 LTS
- User OS & Browser: Brave Version 1.37.116 Chromium: 100.0.4896.127 (Official Build) (64-bit)
- Grafana plugins:
- Others:
@cBiscuitSurprise thanks for sharing this. It seems similar to https://github.com/grafana/grafana/pull/38889 which was added to handle interval variables.
Do you notice any errors in the developer tools of the browser?
I have run into the (presumably) same issue on (dockerised) Grafana 8.4.3.
My issue was fixed by upgrading to 9.1.1
Regardless, here are some things that I noticed during troubleshooting before I tried upgrading the Grafana version.
datasource: mysql
plugins: -
Having a look at the requests my browser sends to my Grafana instance, I noticed that the POST request to /api/ds/query with the expression present does not replace my ${variable} whereas it does work without an expression. I also noted that it doesn't work with the expression present but disabled.
I am running into the same issue with Grafana 9.1.5 (df015a9301) and OpenTSDB as datasource.
I have a variable: AS, with value 65001
My query has the filter: source_as = literal_or($AS) , groupBy = false
When I inspect the query I see the following.
Filter before adding expression:
1:Object
  type:"literal_or"
  tagk:"source_as"
  filter:"65001"
  groupBy:false
Filter after adding expression:
1:Object
  type:"literal_or"
  tagk:"source_as"
  filter:"$AS"
  groupBy:false
It does not matter what the type or content of the Expression is set to.
I've encountered the same issue using the opentsdb data source on grafana v9.2.2 (78a3e64e4f) (When using an expression, variables in the filter are not interpolated.
for example, this query
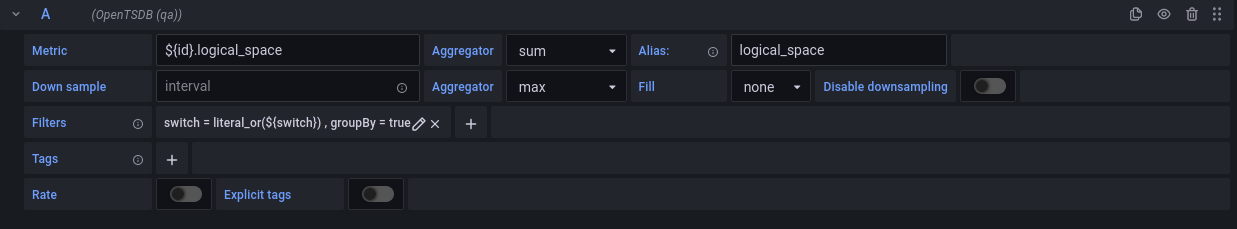 produces this request
{
  "request": {
    "method": "POST",
    "url": "api/datasources/proxy/2/api/query",
    "data": {
      "start": 1667320673130,
      "queries": [
        {
          "metric": "7352718a-04b7-416b-9336-7662c846db28.logical_space",
          "aggregator": "sum",
          "downsample": "2m-max",
          "filters": [
            {
              "type": "literal_or",
              "tagk": "switch",
              "filter": "0f0139c2-1630-5f8e-9876-168007c4c1d0",
              "groupBy": true
            }
          ]
        }
      ],
      "msResolution": false,
      "globalAnnotations": true,
      "showQuery": true
    },
    "hideFromInspector": false
  }
}
the thing to note: "filter": "0f0139c2-1630-5f8e-9876-168007c4c1d0",
but if I run the same query through an expression
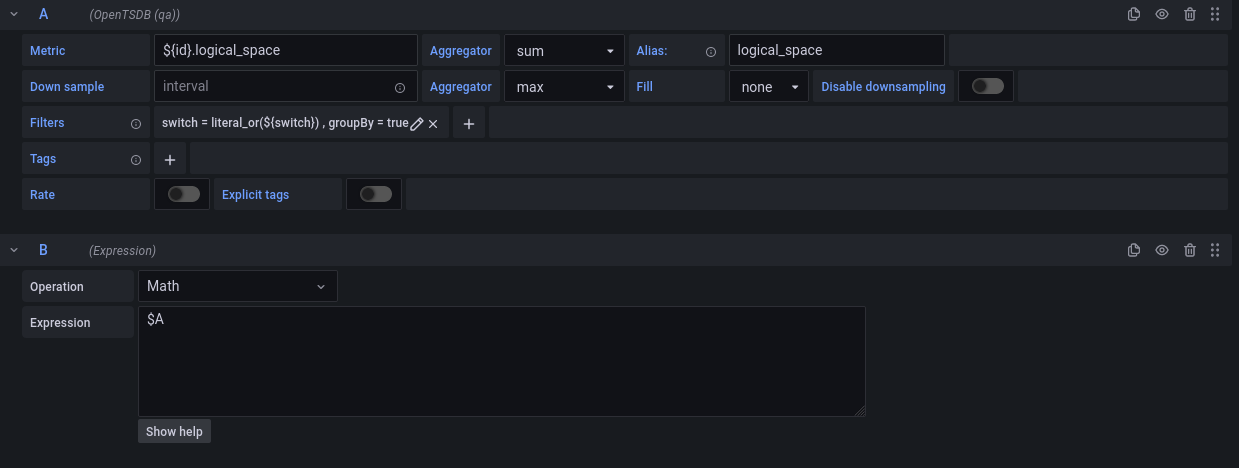 this request is produced
{
  "request": {
    "url": "api/ds/query",
    "method": "POST",
    "data": {
      "queries": [
        {
          "aggregator": "sum",
          "alias": "logical_space",
          "currentFilterGroupBy": false,
          "currentFilterKey": "",
          "currentFilterType": "literal_or",
          "currentFilterValue": "",
          "datasource": {
            "uid": "__V_8rH4z",
            "type": "opentsdb"
          },
          "downsampleAggregator": "max",
          "downsampleFillPolicy": "none",
          "filters": [
            {
              "type": "literal_or",
              "tagk": "switch",
              "filter": "${switch}",
              "groupBy": true
            }
          ],
          "hide": false,
          "metric": "7352718a-04b7-416b-9336-7662c846db28.logical_space",
          "refId": "A",
          "shouldComputeRate": false,
          "currentTagKey": "",
          "currentTagValue": "",
          "tags": {},
          "expression": "",
          "window": "",
          "datasourceId": 2,
          "intervalMs": 120000,
          "maxDataPoints": 1251
        },
        {
          "refId": "B",
          "datasource": {
            "type": "__expr__",
            "uid": "__expr__",
            "name": "Expression"
          },
          "type": "math",
          "hide": false,
          "expression": "$A",
          "window": ""
        }
      ],
      "range": {
        "from": "2022-11-01T16:40:49.606Z",
        "to": "2022-11-03T16:40:49.607Z",
        "raw": {
          "from": "now-2d",
          "to": "now"
        }
      },
      "from": "1667320849606",
      "to": "1667493649607"
    },
    "hideFromInspector": false
  },
}
the variable is being interpolated in the metric name, but not in the filter "filter": "${switch}",
[Edit: added grafana version info]
Hi, is there any way I could move this issue forward? I may even be open to fixing it myself, although I don't know go which may be a problem. Is there anyone watching who is familiar with the code base that could give me some direction? I'm not sure if the issue is in the datasource plugin (it looks like more than one datasource is affected, at least opentsdb and influx, maybe others), or if the problem lies with the expressions functionality. Any help would be appreciated.
The same problem for me. Any update in that theme? I upgrade my Grafana to 9.5.7 version and is still the same error. Using variables in query or using expression are working if I am using it separately on one panel. But if I am using query + expression in one Panel it doesn't work. In Grafana dashboard is 500 query error and those logs from Grafana:
logger=context userId=1 orgId=1 uname=admin t=2023-08-07T10:50:26.971360367Z level=error msg="Query data error" error="expression request error: failed to execute query A: invalid: compilation failed: error @15:80-15:81: invalid expression: invalid token for primary expression: MUL\n\nerror @15:81-15:82: invalid expression @15:79-15:80: \\\n\nerror @20:25-20:26: invalid expression: invalid token for primary expression: MUL\n\nerror @20:26-20:27: invalid expression @20:24-20:25: \\\n\nerror @20:82-20:83: invalid expression: invalid token for primary expression: MUL\n\nerror @20:83-20:85: invalid expression @20:81-20:82: \\\n\nerror @25:24-25:25: invalid expression: invalid token for primary expression: MUL\n\nerror @25:25-25:27: invalid expression @25:23-25:24: \\\n\nerror @25:83-25:84: invalid expression: invalid token for primary expression: MUL\n\nerror @25:84-25:86: invalid expression @25:82-25:83: \\" remote_addr=10.2.100.50 traceID=