Flask-MonitoringDashboard
 Flask-MonitoringDashboard copied to clipboard
Automatically monitor the evolving performance of Flask/Python web services.

The Zeeguu deployment of the FMD is about one year old and it got quite slow. I wonder what's the best way to handle the situation when FMD DB grows...
The Configuration tab is visible for non-admins and its clearly shows the database uri to anyone with access to it. And mysql uri shows the password clearly. I would like...
**Describe the bug** The latest flask doesn't work on jinja2-2.11.1. And your application only runs on jinja2-2.11.1.
**Describe the bug** Installing flask-monitoringdashboard breaks my app which uses Flask-SocketIO. Trying to use websockets produces the following traceback: ``` 127.0.0.1 - - [01/Aug/2021 20:30:29] "GET /socket.io/?EIO=4&transport=websocket HTTP/1.1" 500 -...
**Describe the bug** In FMD 3.1.0 the overview tables are not sortable. Or at least not on the Zeeguu deployment. **To Reproduce** Steps to reproduce the behavior: 1. Go to...
I'm using nginx to multiplex between multiple flask/uwsgi servers. However, flask_monitoringdashboard only logs the IP of the request, which is 127.0.0.1 The following is my nginx.conf: ``` server { listen...
Just saw this message in Homebrew and was reminded that it would be nice to have the same for FMD. We would gain a better understanding of usage without bugging...
how do we use this dashboard when there are multiple flask pods behind an ingress? I see counts getting reset and different counts when the request hits a different pod
There seems to be a bug somewhere. Look at the discrepancy between the existence of hits today and last accessed being three weeks ago! 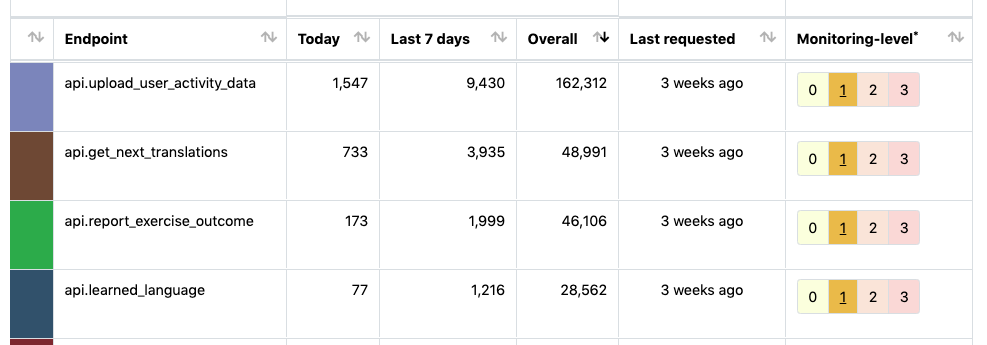
https://github.com/flask-dashboard/Flask-MonitoringDashboard/blob/73586c4aae2ce3cf9052c0915613157db56e43a2/flask_monitoringdashboard/templates/fmd_base.html#L70 this link can't be loaded. I try to change to link from `https://cdnjs.com/libraries/angular-route/1.7.5`, it works. maybe we just change to this one?
Metadata
Owner
Metadata
Automatically monitor the evolving performance of Flask/Python web services.