profiler
 profiler copied to clipboard
Add a "top functions" call tree view
In a "top functions" view, all functions are displayed in a flat list (no tree structure), sorted by "inclusive time", i.e. sorted by the number of samples where this function is present anywhere on the stack.
Example:
Normal:

total self
19    -     (root)
19    -       RunLoop
10    -         ProcessCircles
10    2           ProcessElement
 8    8             Circle::Circumference()
 9    -         ProcessSquares
 9    3           ProcessElement
 6    6             Square::Circumference()

Inverted:

total self
8     8     Circle::Circumference()
8     -       ProcessElement
8     -         ProcessCircles
8     -           RunLoop
8     -             (root)
6     6     Square::Circumference()
6     -       ProcessElement
6     -         ProcessSquares
6     -           RunLoop
6     -             (root)
5     5     ProcessElement
5     -       ProcessSquares
5     -         RunLoop
5     -           (root)
5     -       ProcessCircles
5     -         RunLoop
5     -           (root)

Top functions:

total self
19    -     (root)
19    -     RunLoop
19    5     ProcessElement
10    -     ProcessCircles
 9    -     ProcessSquares
 8    8     Circle::Circumference()
 6    6     Square::Circumference()
In this example, ProcessElement is near the top of the list, and easy to find. In the current call tree you have to look for it under two different stacks.
I think we should have such a mode. We could make it a different mode inside the existing Call Tree tab, or we could have a new tab for it.
In addition, from each function, it should be possible to:
- Restrict the profile to only show samples that contained this function in the stack
- Do the inverse of 1, i.e. remove all samples containing this function in the stack
- Look at the call tree of functions called by the selected function
- Look at the (inverted) call tree of functions that call the selected function
For example, we could split the tab three ways: the list on the left, and two tree views on the right, above each other, with the upper one showing 3 and the lower one showing 4.
┆Issue is synchronized with this Jira Task
FWIW, Jan de Mooij built an external tool to help find the top functions:
https://jandem.github.io/profileviewer/
Would it be possible to use that as a starting point to get something like this added to perf.html?

Note that the view is sortable both by self time or children-included time.
@mikeconley is that the Heaviest Stack Trace sidebar from Instruments

If not, Instruments has also the Top Functions view options for the call tree. It also sounds similar to your description, as Top Functions is defined as
Enabling this makes Instruments consider the total time spent in a function as the sum of the time directly within that function, as well as the time spent in functions called by that function. So if function A calls B, then A’s time is reported as the time spent in A PLUS the time spent in B. This can be really useful, as it lets you pick the largest time figure each time you descend into the call stack, zeroing in on your most time-consuming methods.
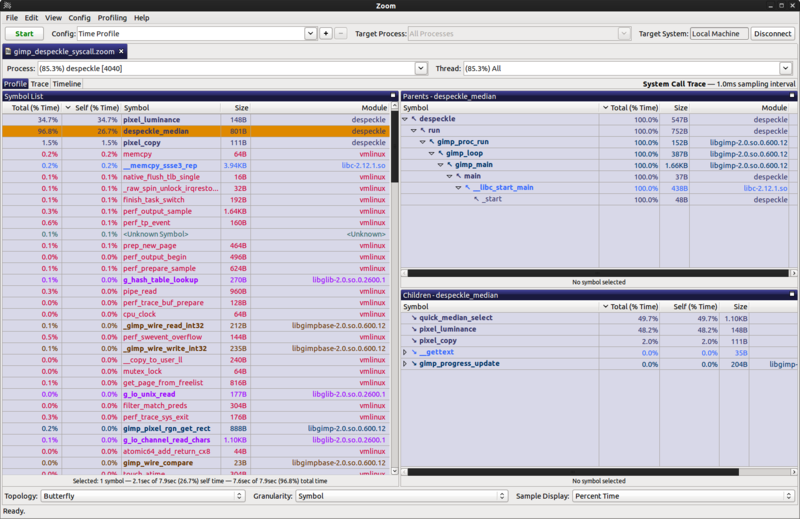
See also this butterfly view experiment (where functions are ordered by self time instead of running time like it should)
This also came up in user feedback again as a list of hot spots that help to orient in a profile.
I like it, but the UI does take its own tab and we'll have to train users on its own workflow.
I wonder if a v0 for this could be simpler. XCode solves it as checkbox in the call tree; which exposes it similarly to "Invert Call Tree" – which seems nice as it has a similar explorational use case.

@mstange @mikeconley would love your input on this Call Tree-based approach.
I don't have a strong opinion. But I think a tri-state selector in the Call Tree tab might work:
[Top-down | Bottom-up | Butterfly]
(actual names to be discussed)
Interestingly I thought of that too :-) The tab was a cheap way to get it out but I think we can do better.
Could we start with the most simple version of this, just the top functions list, no butterfly view?
IMO this would make the profiler a lot more effective. I feel kind of lost when looking at complicated profiles without this view (I use it all the time with other profilers such as Instruments).
I'm a bit confused by the top functions view. Is this any different than the inverted view in the call tree?
Here's an example: (edit: I've also added this to the issue description now)
Normal:

total self
19    -     (root)
19    -       RunLoop
10    -         ProcessCircles
10    2           ProcessElement
 8    8             Circle::Circumference()
 9    -         ProcessSquares
 9    3           ProcessElement
 6    6             Square::Circumference()

Inverted:

total self
8     8     Circle::Circumference()
8     -       ProcessElement
8     -         ProcessCircles
8     -           RunLoop
8     -             (root)
6     6     Square::Circumference()
6     -       ProcessElement
6     -         ProcessSquares
6     -           RunLoop
6     -             (root)
5     5     ProcessElement
5     -       ProcessSquares
5     -         RunLoop
5     -           (root)
5     -       ProcessCircles
5     -         RunLoop
5     -           (root)

Top functions:

total self
19    -     (root)
19    -     RunLoop
19    5     ProcessElement
10    -     ProcessCircles
 9    -     ProcessSquares
 8    8     Circle::Circumference()
 6    6     Square::Circumference()
The top functions view calls attention to ProcessElement, which is present in many samples. The inverted call tree view doesn't call attention to ProcessElement because it doesn't have much self time.
The inverted view orders by the self time, the functions view orders by the running time.
Thanks for the heads-up, I'll put that in our internal backlog
@jandem @mstange would cleaning up the work linked in https://github.com/firefox-devtools/profiler/issues/15#issuecomment-589682581 be good enough as a first step? (see #2388 for the list of left-over tasks).

I feel like it needs some more relationships with the other panels, but this can also be built on top of it later.
Yes, I think that would be a good first step. You could even drop the side panels for now and just have the top functions list. But we do need the performance to be addressed, see my comment in the PR.
@jandem @mstange would cleaning up the work linked in #15 (comment) be good enough as a first step? (see #2388 for the list of left-over tasks).
That looks amazing. Thanks!
Here's a profile where a top functions view would work very well: https://share.firefox.dev/3rM8fEp
Some modules get loaded repeatedly from different stacks. For example, aria-query/lib/index.js shows up in different stacks: https://share.firefox.dev/3rLw530
A top functions view would show the modules in a flat list.
Somewhat related, I was wanting to filter to just a single function the other day profiling mozilla::intl code, and I think a top functions would provide that if I could filter for functions on it.