atom-ide-ui
 atom-ide-ui copied to clipboard
Enhancement: Allow text wrap for Description field in Diagnostics panel
Description
I am, in most cases, only interested in the first result shown Diagnostics, and want to be able to find out as much information as possible about that result with additional activity with the mouse.
Current behavior of Diagnostics is to limit output to a single line, which does not work well with long results or smaller than screen-width panel size.
I would much prefer needing to scroll down for additional diagnostic results, over needing to hover to get the full details of the first result.
Expected Behavior
Long descriptions in Diagnostics will wrap to fit available width, pushing down any additional diagnostic results to make space.
Actual Behavior
Diagnostics limits description to a single line, requiring hovering mouse for tooltip to see any text that does not fit in the available width.
Versions
- Atom: 1.24.0-beta3
- Client OS: Windows 10.0.17074.1002
- atom-ide-ui: 0.7.2
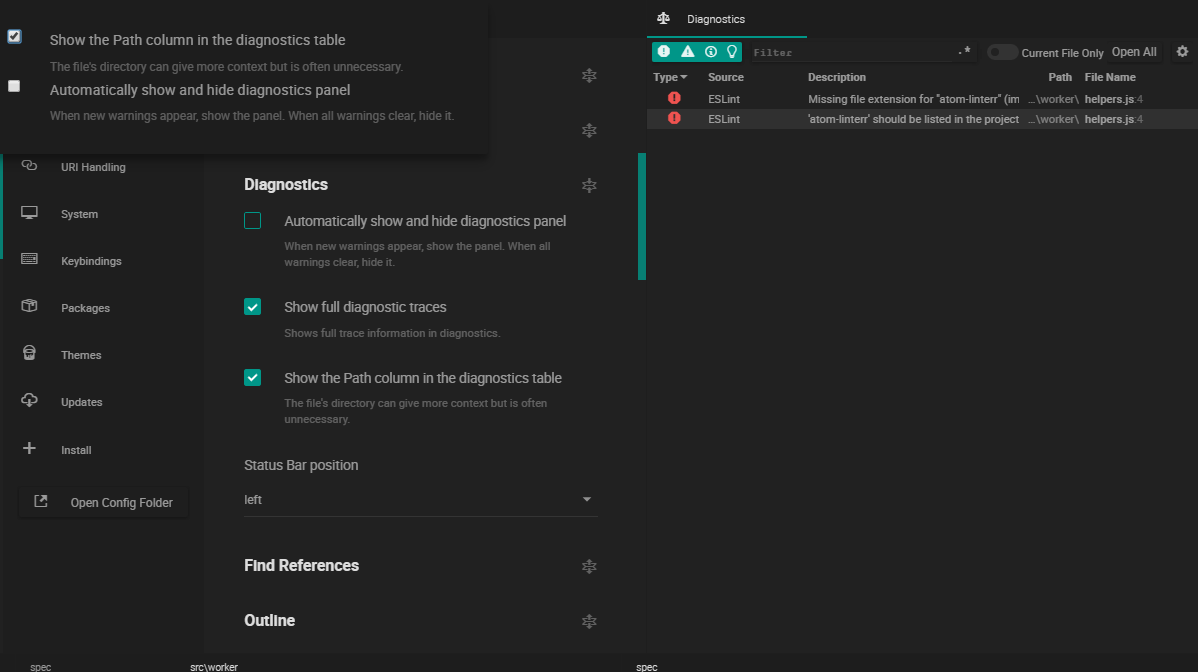
Is this not happening if you toggle the "Full Description" toggle in the panel? (the atom-ide-diagnostics-ui.showDiagnosticTraces setting?)
No, that does not help. The only effect from that setting is that when set to Off it adds some ellipses instead of just truncating at the edge of the bounding box.
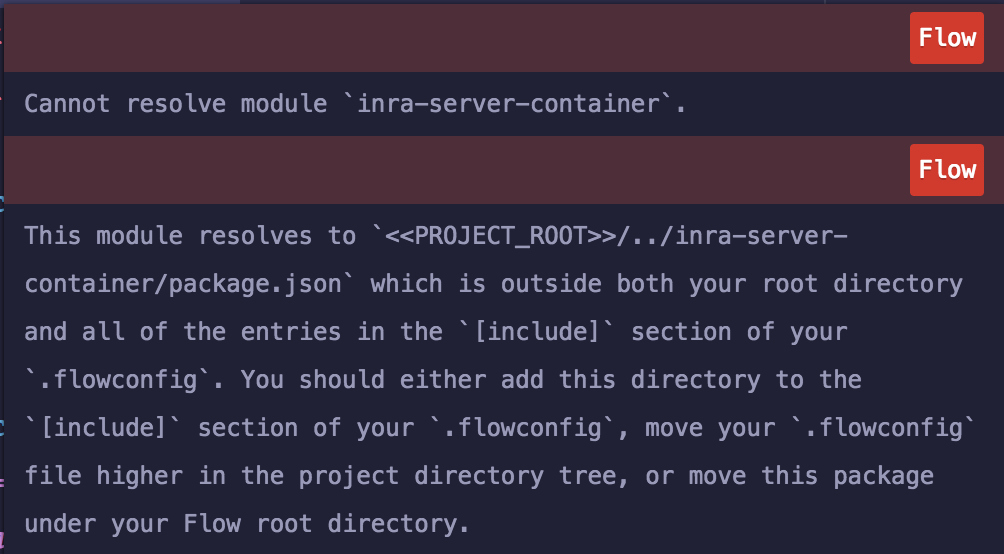
Often line breaks in diagnostic messages are meaningful (Flow results for example). I worry that allowing wrapping would add confusion to the 90% use case in order to support this less common use case.
@captbaritone I am not implying this should be a forced change. A toggle would be ideal, a setting that actually does what it claims an acceptable consolation.
I failed to notice the Show full diagnostic traces setting when I first posted this as an "enhancement". This is actually appears to be a bug in atom-ide-diagnostics-ui.showDiagnosticTraces, as the output with the setting on or off can only be distinguished by on hard-clipping the hidden text instead of showing a nice ellipses. It is certainly not showing me a "full trace", as demonstrated in the image above.
I'm also not sure what makes you think my use-case is uncommon. Linting messages are often somewhat long. Something with a stack trace is gonna be way longer still. People often move their panels around in Atom. It is totally common for people to move things into different sized spaces, and not necessarily keep a panel exactly where the original developers hoped, spreading all the way across the bottom of the screen.
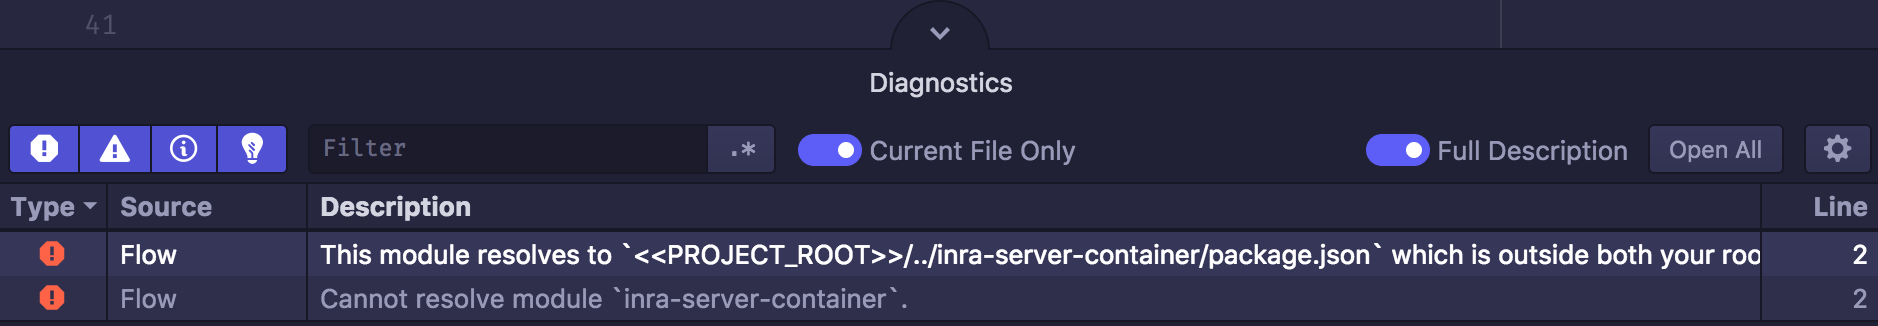
Full description still not working on:
atom-ide-ui: v.0.11.2Atom: v.1.26.1Electron: v.1.7.11Chrome: v.58.0.3029.110Node: v.7.9.0
Error in Diagnostics:
Full error: