erigon
 erigon copied to clipboard
Wrong trie root of block 7499999
System information
Erigon version: erigon version 2.28.0-stable-355837ae
OS & Version: Linux
Commit hash : 355837aee5ea2374bf420eff6e93360deb83d3f7
Expected behaviour
Syncing from scratch should success
Actual behaviour
stuck at IntermediateHashes block 7499999
Steps to reproduce the behaviour
Backtrace
[INFO] [10-19|10:31:39.544] [9/16 IntermediateHashes] Flushed buffer file name=/eth2/temp/erigon-sortable-buf-2992353773 alloc=5.2GB sys=10.8GB
[INFO] [10-19|10:31:48.762] [9/16 IntermediateHashes] Calculating Merkle root current key=ff441455...
[INFO] [10-19|10:31:51.276] [9/16 IntermediateHashes] etl: temp files removed total size=2.5GB
[INFO] [10-19|10:31:51.307] [9/16 IntermediateHashes] etl: temp files removed total size=618.2MB
[INFO] [10-19|10:31:51.307] [9/16 IntermediateHashes] Regeneration ended
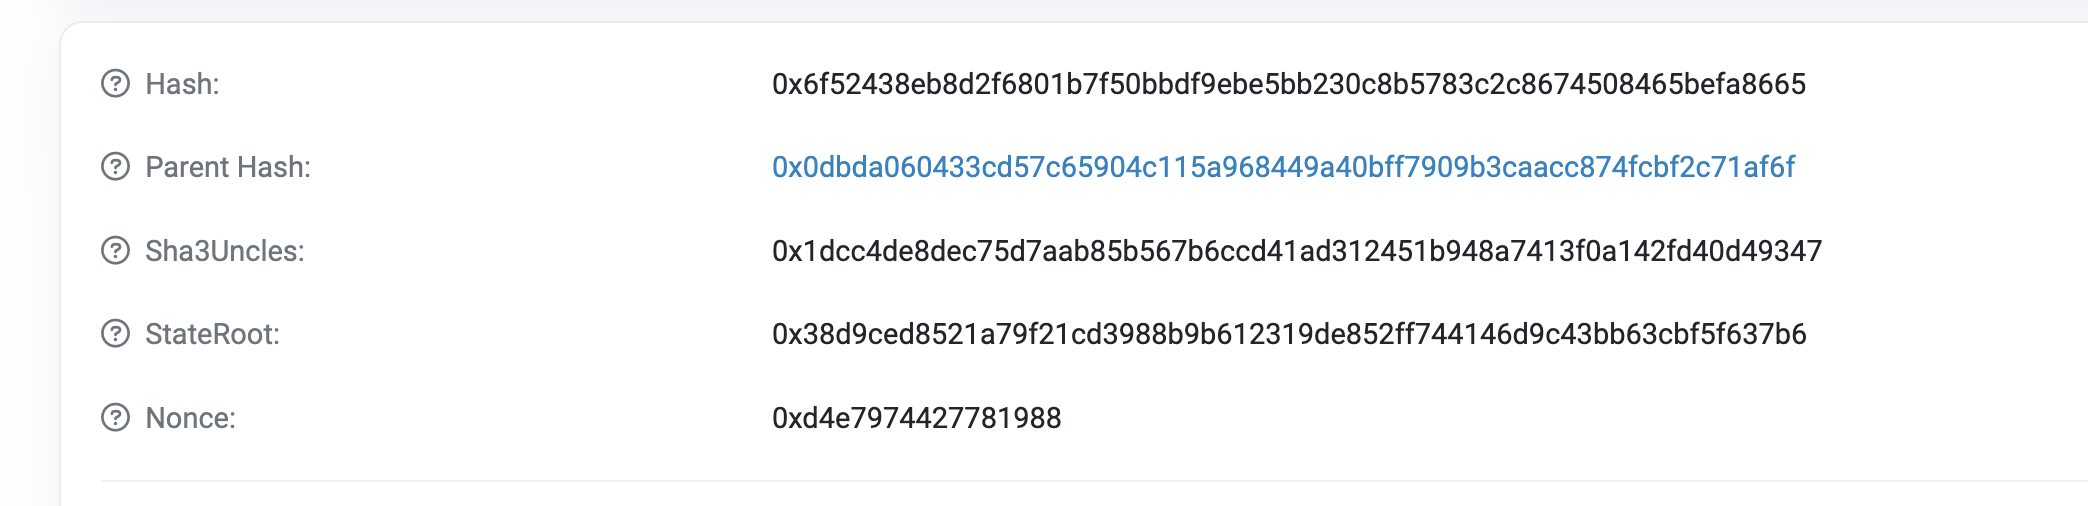
[EROR] [10-19|10:31:51.309] [9/16 IntermediateHashes] Wrong trie root of block 7499999: 3d03b23da4a7eb60cb8a8e7ded135ffe314460f1686940ff773e10695e2fb15c, expected (from header): 38d9ced8521a79f21cd3988b9b612319de852ff744146d9c43bb63cbf5f637b6. Block hash: 6f52438eb8d2f6801b7f50bbdf9ebe5bb230c8b5783c2c8674508465befa8665
[WARN] [10-19|10:31:51.309] Unwinding due to incorrect root hash to=3749999
[INFO] [10-19|10:31:51.309] UnwindTo block=3749999 bad_block_hash=0x6f52438eb8d2f6801b7f50bbdf9ebe5bb230c8b5783c2c8674508465befa8665
[INFO] [10-19|10:31:51.312] [9/16 IntermediateHashes] DONE in=13m2.554754013s
[INFO] [10-19|10:31:51.313] [8/16 HashState] Unwinding started from=7499999 to=3749999 storage=false codes=true
[INFO] [10-19|10:31:55.135] [Downloader] Downloaded PoS Headers now=15638558 blk/sec=115.300
Repeated twice, both stuck at block 7499999, can it be the ssd or memory error?
I don't believe :-)
it looks for me as goerli, or some other mess with 2 networks
do you have other EROR in logs?
I don't believe :-) it looks for me as goerli, or some other mess with 2 networks do you have other
ERORin logs?
Other log lines seems good, but I found a panic when executing block between 1400k~1500k, but the go stack trace is too long so that I cannot figure out what happened (forget to log output to file).
I'm not interested of running goerli node.
Did a memtester 30g 1 and it runs without error.
The server is rented from Hetzner auction, with a Micron_5200_MTFDDAK1T9TDC 1.75tb (/dev/sdc) and SAMSUNG MZ7LH3T8HMLT-00005 3.49tb (/dev/sdd), and the smartctl output is below:
smartctl output
# smartctl -a /dev/sdc
smartctl 7.2 2020-12-30 r5155 [x86_64-linux-5.15.0-50-generic] (local build)
Copyright (C) 2002-20, Bruce Allen, Christian Franke, www.smartmontools.org

=== START OF INFORMATION SECTION ===
Model Family:     Micron 5100 Pro / 52x0 / 5300 SSDs
Device Model:     Micron_5200_MTFDDAK1T9TDC
Serial Number:    18251CF37716
LU WWN Device Id: 5 00a075 11cf37716
Firmware Version: D1MU030
User Capacity:    1,920,383,410,176 bytes [1.92 TB]
Sector Sizes:     512 bytes logical, 4096 bytes physical
Rotation Rate:    Solid State Device
Form Factor:      2.5 inches
TRIM Command:     Available, deterministic, zeroed
Device is:        In smartctl database [for details use: -P show]
ATA Version is:   ACS-3 T13/2161-D revision 5
SATA Version is:  SATA 3.2, 6.0 Gb/s (current: 6.0 Gb/s)
Local Time is:    Thu Oct 20 16:44:47 2022 UTC
SMART support is: Available - device has SMART capability.
SMART support is: Enabled

=== START OF READ SMART DATA SECTION ===
SMART overall-health self-assessment test result: PASSED

General SMART Values:
Offline data collection status:  (0x00) Offline data collection activity
                                        was never started.
                                        Auto Offline Data Collection: Disabled.
Self-test execution status:      (   0) The previous self-test routine completed
                                        without error or no self-test has ever
                                        been run.
Total time to complete Offline
data collection:                ( 6697) seconds.
Offline data collection
capabilities:                    (0x7b) SMART execute Offline immediate.
                                        Auto Offline data collection on/off support.
                                        Suspend Offline collection upon new
                                        command.
                                        Offline surface scan supported.
                                        Self-test supported.
                                        Conveyance Self-test supported.
                                        Selective Self-test supported.
SMART capabilities:            (0x0003) Saves SMART data before entering
                                        power-saving mode.
                                        Supports SMART auto save timer.
Error logging capability:        (0x01) Error logging supported.
                                        General Purpose Logging supported.
Short self-test routine
recommended polling time:        (   2) minutes.
Extended self-test routine
recommended polling time:        (  14) minutes.
Conveyance self-test routine
recommended polling time:        (   3) minutes.
SCT capabilities:              (0x0035) SCT Status supported.
                                        SCT Feature Control supported.
                                        SCT Data Table supported.

SMART Attributes Data Structure revision number: 16
Vendor Specific SMART Attributes with Thresholds:
ID# ATTRIBUTE_NAME          FLAG     VALUE WORST THRESH TYPE      UPDATED  WHEN_FAILED RAW_VALUE
  1 Raw_Read_Error_Rate     0x002f   100   100   050    Pre-fail  Always       -       0
  5 Reallocated_Sector_Ct   0x0032   100   100   001    Old_age   Always       -       0
  9 Power_On_Hours          0x0032   100   100   000    Old_age   Always       -       32054
 12 Power_Cycle_Count       0x0032   100   100   001    Old_age   Always       -       13
170 Reserved_Block_Pct      0x0033   100   100   010    Pre-fail  Always       -       0
171 Program_Fail_Count      0x0032   100   100   000    Old_age   Always       -       0
172 Erase_Fail_Count        0x0032   100   100   001    Old_age   Always       -       0
173 Avg_Block-Erase_Count   0x0032   091   091   000    Old_age   Always       -       665
174 Unexpect_Power_Loss_Ct  0x0032   100   100   000    Old_age   Always       -       7
183 SATA_Int_Downshift_Ct   0x0032   100   100   000    Old_age   Always       -       0
184 End-to-End_Error        0x0032   100   100   000    Old_age   Always       -       0
187 Reported_Uncorrect      0x0032   100   100   000    Old_age   Always       -       0
188 Command_Timeout         0x0032   100   100   000    Old_age   Always       -       0
194 Temperature_Celsius     0x0022   070   053   000    Old_age   Always       -       30 (Min/Max 20/47)
195 Hardware_ECC_Recovered  0x0032   100   100   000    Old_age   Always       -       0
196 Reallocated_Event_Count 0x0032   100   100   000    Old_age   Always       -       0
197 Current_Pending_Sector  0x0032   100   100   000    Old_age   Always       -       0
198 Offline_Uncorrectable   0x0030   100   100   000    Old_age   Offline      -       0
199 UDMA_CRC_Error_Count    0x0032   100   100   000    Old_age   Always       -       0
202 Percent_Lifetime_Remain 0x0030   091   091   001    Old_age   Offline      -       9
206 Write_Error_Rate        0x000e   100   100   000    Old_age   Always       -       0
246 Total_LBAs_Written      0x0032   100   100   000    Old_age   Always       -       1098490638932
247 Host_Program_Page_Count 0x0032   100   100   000    Old_age   Always       -       34297380976
248 Bckgnd_Program_Page_Cnt 0x0032   100   100   000    Old_age   Always       -       66647622317
180 Unused_Rsvd_Blk_Cnt_Tot 0x0033   000   000   000    Pre-fail  Always       -       6718
210 RAIN_Success_Recovered  0x0032   100   100   000    Old_age   Always       -       0
211 Integ_Scan_Complete_Cnt 0x0032   100   100   000    Old_age   Always       -       2
212 Integ_Scan_Folding_Cnt  0x0032   100   100   000    Old_age   Always       -       0

SMART Error Log Version: 1
No Errors Logged

SMART Self-test log structure revision number 1
Num  Test_Description    Status                  Remaining  LifeTime(hours)  LBA_of_first_error
# 1  Extended offline    Completed without error       00%     31711         -
# 2  Extended offline    Completed without error       00%     31692         -
# 3  Vendor (0xff)       Completed without error       00%     31657         -
# 4  Vendor (0xff)       Completed without error       00%     31579         -
# 5  Vendor (0xff)       Completed without error       00%     31315         -
# 6  Vendor (0xff)       Completed without error       00%     31051         -
# 7  Vendor (0xff)       Completed without error       00%     30787         -
# 8  Vendor (0xff)       Completed without error       00%     30523         -
# 9  Vendor (0xff)       Completed without error       00%     30259         -
#10  Vendor (0xff)       Completed without error       00%     29995         -
#11  Vendor (0xff)       Completed without error       00%     29731         -
#12  Vendor (0xff)       Completed without error       00%     29467         -
#13  Vendor (0xff)       Completed without error       00%     29203         -
#14  Vendor (0xff)       Completed without error       00%     28939         -
#15  Vendor (0xff)       Completed without error       00%     28675         -
#16  Vendor (0xff)       Completed without error       00%     28411         -
#17  Vendor (0xff)       Completed without error       00%     28147         -
#18  Vendor (0xff)       Completed without error       00%     27883         -
#19  Vendor (0xff)       Completed without error       00%     27619         -
#20  Vendor (0xff)       Completed without error       00%     27355         -
#21  Vendor (0xff)       Completed without error       00%     27086         -

SMART Selective self-test log data structure revision number 1
 SPAN  MIN_LBA  MAX_LBA  CURRENT_TEST_STATUS
    1        0        0  Not_testing
    2        0        0  Not_testing
    3        0        0  Not_testing
    4        0        0  Not_testing
    5        0        0  Not_testing
Selective self-test flags (0x0):
  After scanning selected spans, do NOT read-scan remainder of disk.
If Selective self-test is pending on power-up, resume after 0 minute delay.
# smartctl -a /dev/sdd
smartctl 7.2 2020-12-30 r5155 [x86_64-linux-5.15.0-50-generic] (local build)
Copyright (C) 2002-20, Bruce Allen, Christian Franke, www.smartmontools.org

=== START OF INFORMATION SECTION ===
Model Family:     Samsung based SSDs
Device Model:     SAMSUNG MZ7LH3T8HMLT-00005
Serial Number:    S456NY0M802236
LU WWN Device Id: 5 002538 e0983eb6d
Firmware Version: HXT7A04Q
User Capacity:    3,840,755,982,336 bytes [3.84 TB]
Sector Sizes:     512 bytes logical, 4096 bytes physical
Rotation Rate:    Solid State Device
Form Factor:      2.5 inches
TRIM Command:     Available, deterministic, zeroed
Device is:        In smartctl database [for details use: -P show]
ATA Version is:   ACS-4 T13/BSR INCITS 529 revision 5
SATA Version is:  SATA 3.2, 6.0 Gb/s (current: 6.0 Gb/s)
Local Time is:    Thu Oct 20 16:45:08 2022 UTC
SMART support is: Available - device has SMART capability.
SMART support is: Enabled

=== START OF READ SMART DATA SECTION ===
SMART overall-health self-assessment test result: PASSED

General SMART Values:
Offline data collection status:  (0x00) Offline data collection activity
                                        was never started.
                                        Auto Offline Data Collection: Disabled.
Self-test execution status:      (   0) The previous self-test routine completed
                                        without error or no self-test has ever
                                        been run.
Total time to complete Offline
data collection:                (    0) seconds.
Offline data collection
capabilities:                    (0x53) SMART execute Offline immediate.
                                        Auto Offline data collection on/off support.
                                        Suspend Offline collection upon new
                                        command.
                                        No Offline surface scan supported.
                                        Self-test supported.
                                        No Conveyance Self-test supported.
                                        Selective Self-test supported.
SMART capabilities:            (0x0003) Saves SMART data before entering
                                        power-saving mode.
                                        Supports SMART auto save timer.
Error logging capability:        (0x01) Error logging supported.
                                        General Purpose Logging supported.
Short self-test routine
recommended polling time:        (   2) minutes.
Extended self-test routine
recommended polling time:        ( 200) minutes.
SCT capabilities:              (0x003d) SCT Status supported.
                                        SCT Error Recovery Control supported.
                                        SCT Feature Control supported.
                                        SCT Data Table supported.

SMART Attributes Data Structure revision number: 1
Vendor Specific SMART Attributes with Thresholds:
ID# ATTRIBUTE_NAME          FLAG     VALUE WORST THRESH TYPE      UPDATED  WHEN_FAILED RAW_VALUE
  5 Reallocated_Sector_Ct   0x0033   100   100   010    Pre-fail  Always       -       0
  9 Power_On_Hours          0x0032   095   095   000    Old_age   Always       -       24625
 12 Power_Cycle_Count       0x0032   099   099   000    Old_age   Always       -       14
177 Wear_Leveling_Count     0x0013   097   097   005    Pre-fail  Always       -       169
179 Used_Rsvd_Blk_Cnt_Tot   0x0013   100   100   010    Pre-fail  Always       -       0
180 Unused_Rsvd_Blk_Cnt_Tot 0x0013   100   100   010    Pre-fail  Always       -       11644
181 Program_Fail_Cnt_Total  0x0032   100   100   010    Old_age   Always       -       0
182 Erase_Fail_Count_Total  0x0032   100   100   010    Old_age   Always       -       0
183 Runtime_Bad_Block       0x0013   100   100   010    Pre-fail  Always       -       0
184 End-to-End_Error        0x0033   100   100   097    Pre-fail  Always       -       0
187 Uncorrectable_Error_Cnt 0x0032   100   100   000    Old_age   Always       -       0
190 Airflow_Temperature_Cel 0x0032   066   058   000    Old_age   Always       -       34
194 Temperature_Celsius     0x0022   066   056   000    Old_age   Always       -       34 (Min/Max 28/44)
195 ECC_Error_Rate          0x001a   200   200   000    Old_age   Always       -       0
197 Current_Pending_Sector  0x0032   100   100   000    Old_age   Always       -       0
199 CRC_Error_Count         0x003e   100   100   000    Old_age   Always       -       0
202 Exception_Mode_Status   0x0033   100   100   010    Pre-fail  Always       -       0
235 POR_Recovery_Count      0x0012   099   099   000    Old_age   Always       -       7
241 Total_LBAs_Written      0x0032   099   099   000    Old_age   Always       -       1158330069514
242 Total_LBAs_Read         0x0032   099   099   000    Old_age   Always       -       76528387153
243 SATA_Downshift_Ct       0x0032   100   100   000    Old_age   Always       -       0
244 Thermal_Throttle_St     0x0032   100   100   000    Old_age   Always       -       0
245 Timed_Workld_Media_Wear 0x0032   100   100   000    Old_age   Always       -       65535
246 Timed_Workld_RdWr_Ratio 0x0032   100   100   000    Old_age   Always       -       65535
247 Timed_Workld_Timer      0x0032   100   100   000    Old_age   Always       -       65535
251 NAND_Writes             0x0032   100   100   000    Old_age   Always       -       1463937383296

SMART Error Log Version: 1
No Errors Logged

SMART Self-test log structure revision number 1
Num  Test_Description    Status                  Remaining  LifeTime(hours)  LBA_of_first_error
# 1  Extended offline    Completed without error       00%     24284         -
# 2  Extended offline    Completed without error       00%     24265         -

SMART Selective self-test log data structure revision number 1
 SPAN  MIN_LBA  MAX_LBA  CURRENT_TEST_STATUS
    1        0        0  Not_testing
    2        0        0  Not_testing
    3        0        0  Not_testing
    4        0        0  Not_testing
    5        0        0  Not_testing
Selective self-test flags (0x0):
  After scanning selected spans, do NOT read-scan remainder of disk.
If Selective self-test is pending on power-up, resume after 0 minute delay.
other info: sda and sdd is hdd harddisk and do not involved, two sata ssd to form a lvm for root filesystem
# lsblk
NAME         MAJ:MIN RM  SIZE RO TYPE MOUNTPOINTS
sda            8:0    1  3.6T  0 disk
└─hdd-hdd    253:0    0  7.3T  0 lvm  /hdd
sdb            8:16   1  3.6T  0 disk
└─hdd-hdd    253:0    0  7.3T  0 lvm  /hdd
sdc            8:32   1  1.7T  0 disk
├─sdc1         8:33   1    2G  0 part /boot
└─sdc2         8:34   1  1.7T  0 part
  └─vg0-root 253:1    0  5.2T  0 lvm  /
sdd            8:48   1  3.5T  0 disk
└─vg0-root   253:1    0  5.2T  0 lvm  /
Could somebody help me parse these output, is the disk health ok?
Now, I'm trying to re-run from scratch without torrent downloader sync --snapshots=false, with prysm
If still fails, I'll try other servers.
In go trace see only first 30 lines
true, I forget to enlarget screen size before (so first lines not available), I have set scrollback 100000, and waiting for another golang panic...
Having same problem with sync being stuck on same block 7499999 on goerli testnet:
erigon_testnet  | [INFO] [10-31|22:44:44.372] Build info                               git_branch=heads/v2.28.1 git_tag=v2.28.1-dirty git_commit=9711af6ddf01f1eb96c9dfb7bf33c5d69e6f648a
erigon_testnet  | [INFO] [10-31|22:44:44.372] Starting Erigon on Görli testnet...
erigon_testnet  | [INFO] [10-31|22:44:44.375] Maximum peer count                       ETH=100 total=100
erigon_testnet  | [INFO] [10-31|22:44:44.375] starting HTTP APIs                       APIs=eth,erigon,engine,web3,net,debug,trace,txpool
erigon_testnet  | [INFO] [10-31|22:44:44.375] torrent verbosity                        level=WRN
erigon_testnet  | [INFO] [10-31|22:44:46.479] Set global gas cap                       cap=50000000
erigon_testnet  | [INFO] [10-31|22:44:46.487] Opening Database                         label=chaindata path=/home/erigon/.local/share/erigon/goerli/chaindata
erigon_testnet  | [INFO] [10-31|22:44:46.523] Initialised chain configuration          config="{ChainID: 5, Homestead: 0, DAO: <nil>, DAO Support: true, Tangerine Whistle: 0, Spurious Dragon: 0, Byzantium: 0, Constantinople: 0, Petersburg: 0, Istanbul: 1561651, Muir Glacier: <nil>, Berlin: 4460644, London: 5062605, Arrow Glacier: <nil>, Gray Glacier: <nil>, Terminal Total Difficulty: 10790000, Merge Netsplit: <nil>, Shanghai: <nil>, Cancun: <nil>, Engine: clique}" genesis=0xbf7e331f7f7c1dd2e05159666b3bf8bc7a8a3a9eb1d518969eab529dd9b88c1a
erigon_testnet  | [INFO] [10-31|22:44:46.523] Effective                                prune_flags= snapshot_flags="--snapshots=true" history.v3=false
erigon_testnet  | [INFO] [10-31|22:44:47.577] Initialising Ethereum protocol           network=5
erigon_testnet  | [INFO] [10-31|22:44:47.659] Starting private RPC server              on=127.0.0.1:9090
erigon_testnet  | [INFO] [10-31|22:44:47.659] new subscription to logs established
erigon_testnet  | [INFO] [10-31|22:44:47.660] rpc filters: subscribing to Erigon events
erigon_testnet  | [INFO] [10-31|22:44:47.660] new subscription to newHeaders established
erigon_testnet  | [INFO] [10-31|22:44:47.660] New txs subscriber joined
erigon_testnet  | [INFO] [10-31|22:44:47.663] Reading JWT secret                       path=/home/erigon/.local/share/erigon/goerli/jwt.hex
erigon_testnet  | [INFO] [10-31|22:44:47.664] HTTP endpoint opened for Engine API      url=0.0.0.0:8551 ws=true ws.compression=true
erigon_testnet  | [INFO] [10-31|22:44:47.665] HTTP endpoint opened                     url=0.0.0.0:8545 ws=false ws.compression=true grpc=false
erigon_testnet  | [INFO] [10-31|22:44:47.671] [txpool] Started
erigon_testnet  | [INFO] [10-31|22:44:47.677] [1/16 Snapshots] Fetching torrent files metadata
erigon_testnet  | [INFO] [10-31|22:44:47.729] Started P2P networking                   version=66 self=enode://663a054a0fa7f49832e855992518b53921c0a5a72b8c94e4d5c71a5c23a33b7c26c0e944d61777620b3f12ddd90616c2ceae74ab00ff2d4009bbfd3344ce49b8@127.0.0.1:30303 name=erigon/v2.28.1-stable-9711af6d/linux-amd64/go1.19.2
erigon_testnet  | [INFO] [10-31|22:44:49.511] [Snapshots] Blocks Stat                  blocks=7500k indices=7500k alloc=692.2MB sys=767.9MB
erigon_testnet  | [INFO] [10-31|22:44:51.076] [2/16 Headers] Waiting for Consensus Layer...
erigon_testnet  | [INFO] [10-31|22:45:47.661] [txpool] stat                            block=7499999 pending=0 baseFee=0 queued=17 alloc=928.9MB sys=1021.1MB
erigon_testnet  | [WARN] [10-31|22:46:29.891] no pending block found returning latest executed block
erigon_testnet  | [WARN] [10-31|22:46:30.345] no pending block found returning latest executed block
erigon_testnet  | [WARN] [10-31|22:46:30.793] no pending block found returning latest executed block
erigon_testnet  | [WARN] [10-31|22:46:31.243] no pending block found returning latest executed block
erigon_testnet  | [WARN] [10-31|22:46:31.693] no pending block found returning latest executed block
erigon_testnet  | [WARN] [10-31|22:46:32.183] no pending block found returning latest executed block
erigon_testnet  | [WARN] [10-31|22:46:32.673] no pending block found returning latest executed block
erigon_testnet  | [WARN] [10-31|22:46:33.153] no pending block found returning latest executed block
erigon_testnet  | [WARN] [10-31|22:46:33.654] no pending block found returning latest executed block
erigon_testnet  | [INFO] [10-31|22:46:47.577] [p2p] GoodPeers                          eth66=0
erigon_testnet  | [INFO] [10-31|22:46:47.661] [txpool] stat                            block=7499999 pending=0 baseFee=0 queued=17 alloc=997.6MB sys=1.1GB
erigon_testnet  | [INFO] [10-31|22:47:47.661] [txpool] stat                            block=7499999 pending=0 baseFee=0 queued=17 alloc=723.2MB sys=1.1GB
...
erigon_testnet  | [INFO] [10-31|23:06:47.577] [p2p] GoodPeers                          eth66=33
erigon_testnet  | [INFO] [10-31|23:06:47.661] [txpool] stat                            block=7499999 pending=0 baseFee=0 queued=17 alloc=927.6MB sys=1.1GB
erigon_testnet  | [INFO] [10-31|23:07:47.661] [txpool] stat                            block=7499999 pending=0 baseFee=0 queued=17 alloc=801.3MB sys=1.1GB
erigon_testnet  | [WARN] [10-31|23:08:28.667] no pending block found returning latest executed block
erigon_testnet  | [WARN] [10-31|23:08:29.112] no pending block found returning latest executed block
erigon_testnet  | [WARN] [10-31|23:08:29.550] no pending block found returning latest executed block
erigon_testnet  | [WARN] [10-31|23:08:29.996] no pending block found returning latest executed block
erigon_testnet  | [WARN] [10-31|23:08:30.432] no pending block found returning latest executed block
erigon_testnet  | [WARN] [10-31|23:08:30.867] no pending block found returning latest executed block
erigon_testnet  | [WARN] [10-31|23:08:31.311] no pending block found returning latest executed block
erigon_testnet  | [WARN] [10-31|23:08:31.745] no pending block found returning latest executed block
erigon_testnet  | [WARN] [10-31|23:08:32.219] no pending block found returning latest executed block
And this goes on forever, restart doesn't help.
./build/bin/integration print_stages- do you have Consensus Layer? any errors there?
Hi,
I just started learning staking via eth-docker.
I am stuck on goerli at block 7 499 999 too (using eth-docker latest) erigon git_tag=v2.30.0-dirty (I see in logs):
execution_1                  | goerli: Running with prune.r.before=4367322 for eth deposit contract
execution_1                  | [WARN] [11-30|10:23:40.151] no log dir set, console logging only
execution_1                  | [INFO] [11-30|10:23:40.151] Starting metrics server                  addr=http://0.0.0.0:6060/debug/metrics/prometheus
execution_1                  | [WARN] [11-30|10:23:40.156] no log dir set, console logging only
execution_1                  | [INFO] [11-30|10:23:40.156] Build info                               git_branch=stable git_tag=v2.30.0-dirty git_commit=35f493c5d0
21965f994bee615d441b2b35811f8f
execution_1                  | [INFO] [11-30|10:23:40.157] Starting Erigon on Görli testnet...
execution_1                  | [INFO] [11-30|10:23:40.174] Maximum peer count                       ETH=100 total=100
execution_1                  | [INFO] [11-30|10:23:40.175] starting HTTP APIs                       APIs=web3,eth,net,engine
execution_1                  | [INFO] [11-30|10:23:40.175] torrent verbosity                        level=WRN
execution_1                  | [INFO] [11-30|10:23:42.286] Set global gas cap                       cap=50000000
execution_1                  | [WARN] [11-30|10:23:42.290] specifying prune.before.r might break CL compatibility
execution_1                  | [INFO] [11-30|10:23:42.293] Opening Database                         label=chaindata path=/var/lib/erigon/chaindata
execution_1                  | [INFO] [11-30|10:23:42.305] Re-Opening DB in exclusive mode to apply migrations
execution_1                  | [INFO] [11-30|10:23:42.313] Apply migration                          name=db_schema_version5
execution_1                  | [INFO] [11-30|10:23:42.317] Applied migration                        name=db_schema_version5
execution_1                  | [INFO] [11-30|10:23:42.317] Apply migration                          name=txs_begin_end
execution_1                  | [INFO] [11-30|10:23:42.320] Applied migration                        name=txs_begin_end
execution_1                  | [INFO] [11-30|10:23:42.321] Apply migration                          name=reset_blocks_4
execution_1                  | [INFO] [11-30|10:23:42.324] Applied migration                        name=reset_blocks_4
execution_1                  | [INFO] [11-30|10:23:42.327] Updated DB schema to                     version=6.0.0
execution_1                  | [INFO] [11-30|10:23:42.362] Writing custom genesis block             hash=0xbf7e331f7f7c1dd2e05159666b3bf8bc7a8a3a9eb1d518969eab52
9dd9b88c1a
execution_1                  | [INFO] [11-30|10:23:42.367] Initialised chain configuration          config="{ChainID: 5, Homestead: 0, DAO: <nil>, DAO Support: t
rue, Tangerine Whistle: 0, Spurious Dragon: 0, Byzantium: 0, Constantinople: 0, Petersburg: 0, Istanbul: 1561651, Muir Glacier: <nil>, Berlin: 4460644, London: 5062605,
 Arrow Glacier: <nil>, Gray Glacier: <nil>, Terminal Total Difficulty: 10790000, Merge Netsplit: <nil>, Shanghai: <nil>, Cancun: <nil>, Engine: clique}" genesis=0xbf7e3
31f7f7c1dd2e05159666b3bf8bc7a8a3a9eb1d518969eab529dd9b88c1a
execution_1                  | [INFO] [11-30|10:23:42.368] Effective                                prune_flags="--prune.h.older=90000 --prune.t.older=90000 --pr
une.c.older=90000 --prune.r.before=4367322" snapshot_flags="--snapshots=true" history.v3=false
execution_1                  | [INFO] [11-30|10:23:42.387] Initialising Ethereum protocol           network=5
execution_1                  | [INFO] [11-30|10:23:42.412] new subscription to logs established
execution_1                  | [INFO] [11-30|10:23:42.412] Starting private RPC server              on=0.0.0.0:9090
execution_1                  | [INFO] [11-30|10:23:42.417] rpc filters: subscribing to Erigon events
execution_1                  | [INFO] [11-30|10:23:42.419] new subscription to newHeaders established
execution_1                  | [INFO] [11-30|10:23:42.419] New txs subscriber joined
execution_1                  | [INFO] [11-30|10:23:42.421] Reading JWT secret                       path=/var/lib/erigon/ee-secret/jwtsecret
execution_1                  | [INFO] [11-30|10:23:42.421] HTTP endpoint opened for Engine API      url=0.0.0.0:8551 ws=true ws.compression=true
execution_1                  | [INFO] [11-30|10:23:42.421] HTTP endpoint opened                     url=0.0.0.0:8545 ws=true ws.compression=true grpc=false
execution_1                  | [INFO] [11-30|10:23:42.431] [1/16 Snapshots] Fetching torrent files metadata
execution_1                  | [INFO] [11-30|10:23:42.433] [Snapshots] Blocks Stat                  blocks=0k indices=0k alloc=47.9MB sys=68.1MB
execution_1                  | [INFO] [11-30|10:23:42.430] [txpool] Started
execution_1                  | [INFO] [11-30|10:23:42.438] [2/16 Headers] Waiting for Consensus Layer...
execution_1                  | [INFO] [11-30|10:23:42.459] Started P2P networking                   version=66 self=enode://6006a154ccb0e6b8e9a8203f3245847ab6eff
08488cdd53f9fc728137686da56a9fe88f65cacfdfcebf2b7aba934c74f6fcf2f708ba3954f59057b0afc9d4889@127.0.0.1:30303 name=erigon/v2.30.0-stable-35f493c5/linux-amd64/go1.19.3
execution_1                  | [INFO] [11-30|10:23:59.806] [2/16 Headers] Handling new payload      height=8047588 hash=0xa76747cdcd63e554e944517f4d37576955ba15a
f773d518ed4706ca202bb0344
execution_1                  | [INFO] [11-30|10:23:59.806] [2/16 Headers] Downloading PoS headers... height=8047587 hash=0x5abb0a78e83ce13597ee40126b48049fd3445e
0ba30aefdb5b2154427c0351ef requestId=1
execution_1                  | [INFO] [11-30|10:24:20.024] [Downloader] posAnchor                   blockHeight=8047588
execution_1                  | [INFO] [11-30|10:24:20.421] [Downloader] posAnchor                   blockHeight=8047396
execution_1                  | [INFO] [11-30|10:24:25.742] [Downloader] posAnchor                   blockHeight=8047396
execution_1                  | [INFO] [11-30|10:24:42.430] [txpool] stat                            block=0 pending=0 baseFee=0 queued=0 alloc=127.9MB sys=228.5M

...

execution_1                  | [INFO] [12-01|10:10:39.160] [txpool] stat                            block=7499999 pending=69 baseFee=3 queued=646 alloc=2.4GB sys=2.8GB
execution_1                  | [INFO] [12-01|10:10:58.922] [7/16 Execution] Executed blocks         number=3011782 blk/s=144.0 tx/s=203.0 Mgas/s=85.1 gasState=0.19 batch=135.6MB alloc=1.6GB sys=2.8GB
execution_1                  | [INFO] [12-01|10:11:18.956] [7/16 Execution] Executed blocks         number=3014616 blk/s=141.5 tx/s=238.7 Mgas/s=121.2 gasState=0.19 batch=138.0MB alloc=2.2GB sys=2.8GB
execution_1                  | [INFO] [12-01|10:11:39.033] [7/16 Execution] Executed blocks         number=3015211 blk/s=29.7 tx/s=38.0 Mgas/s=23.8 gasState=0.19 batch=138.4MB alloc=1.4GB sys=2.8GB
execution_1                  | [INFO] [12-01|10:11:39.160] [txpool] stat                            block=7499999 pending=69 baseFee=3 queued=646 alloc=1.4GB sys=2.8GB
execution_1                  | [INFO] [12-01|10:11:58.946] [7/16 Execution] Executed blocks         number=3015669 blk/s=23.0 tx/s=44.9 Mgas/s=49.5 gasState=0.19 batch=139.6MB alloc=1.6GB sys=2.8GB
execution_1                  | [INFO] [12-01|10:12:18.930] [7/16 Execution] Executed blocks         number=3016179 blk/s=25.5 tx/s=44.8 Mgas/s=58.1 gasState=0.20 batch=140.3MB alloc=1.8GB sys=2.8GB
execution_1                  | [INFO] [12-01|10:12:38.838] [p2p] GoodPeers                          eth66=36
execution_1                  | [INFO] [12-01|10:12:38.909] [7/16 Execution] Executed blocks         number=3016642 blk/s=23.2 tx/s=41.1 Mgas/s=50.1 gasState=0.20 batch=140.9MB alloc=2.0GB sys=2.8GB
execution_1                  | [INFO] [12-01|10:12:39.168] [txpool] stat                            block=7499999 pending=69 baseFee=3 queued=646 alloc=2.0GB sys=2.8GB
And Grafana (basic config) show me some strange info: like Erigon is on Prater > mainnet > bellatrix and syncing status: 0% and stuck on block 7499 999
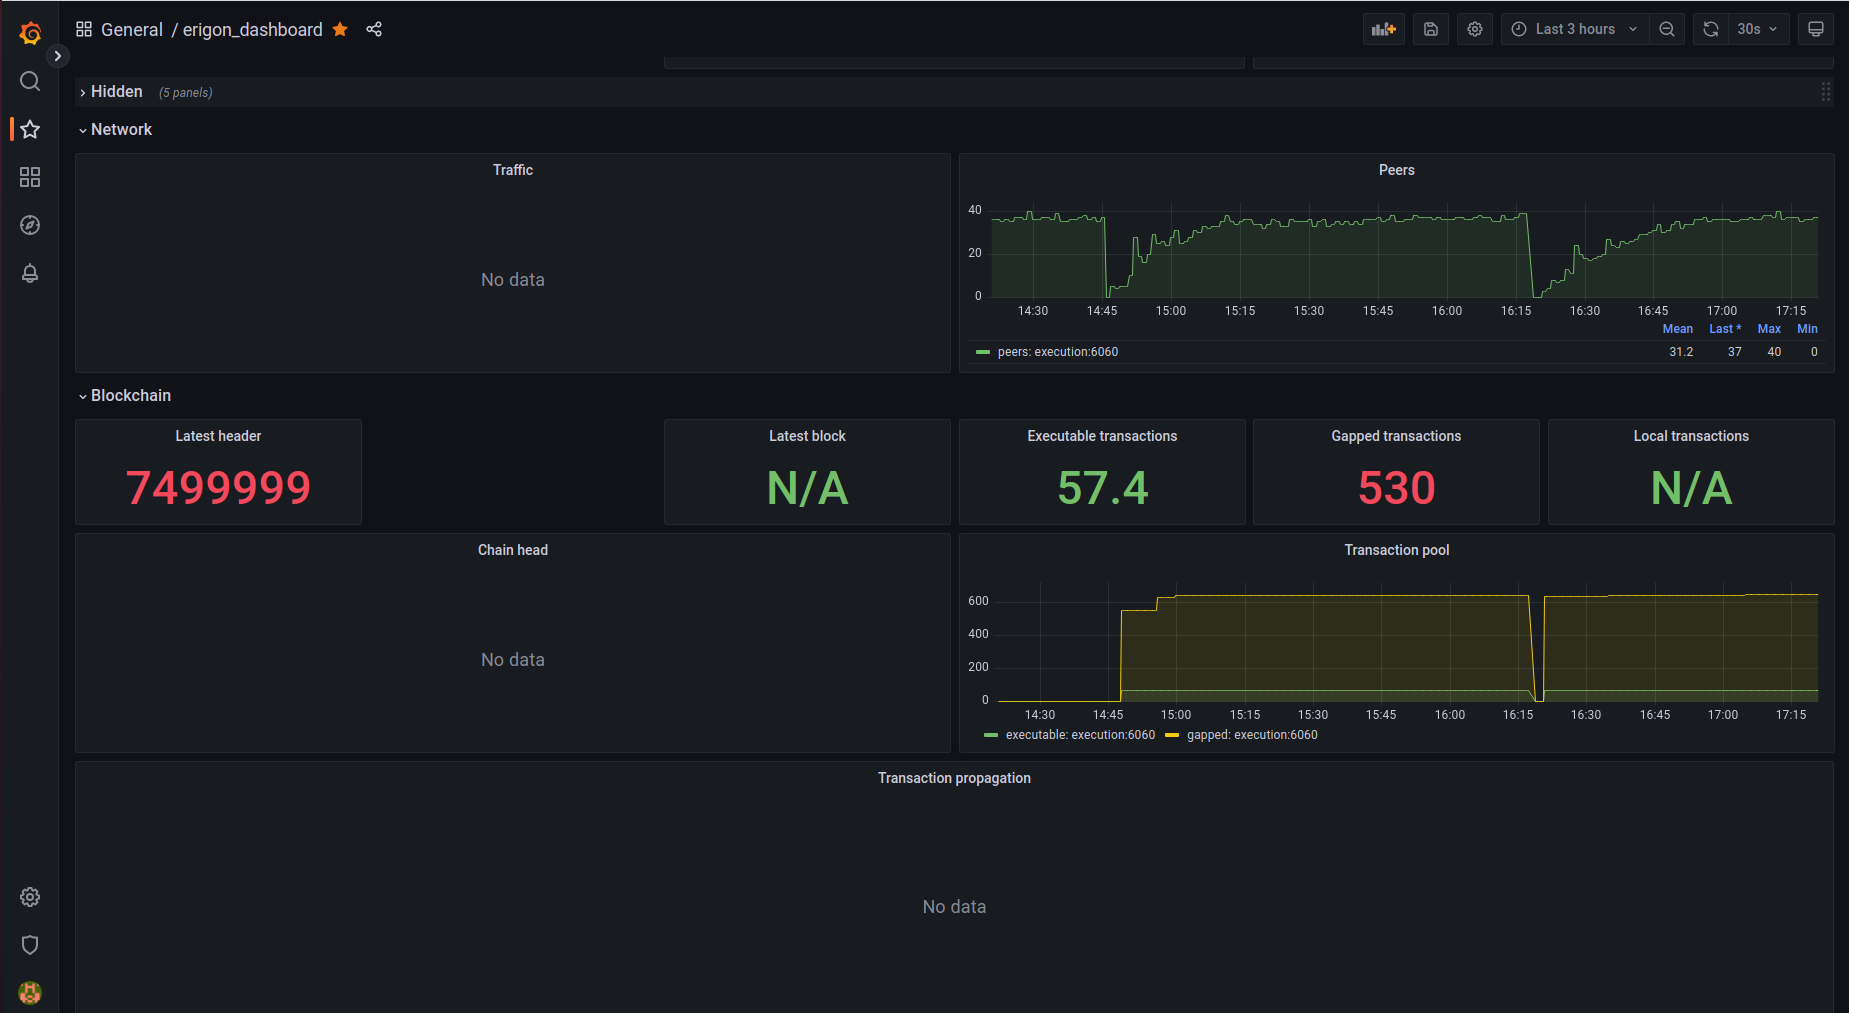
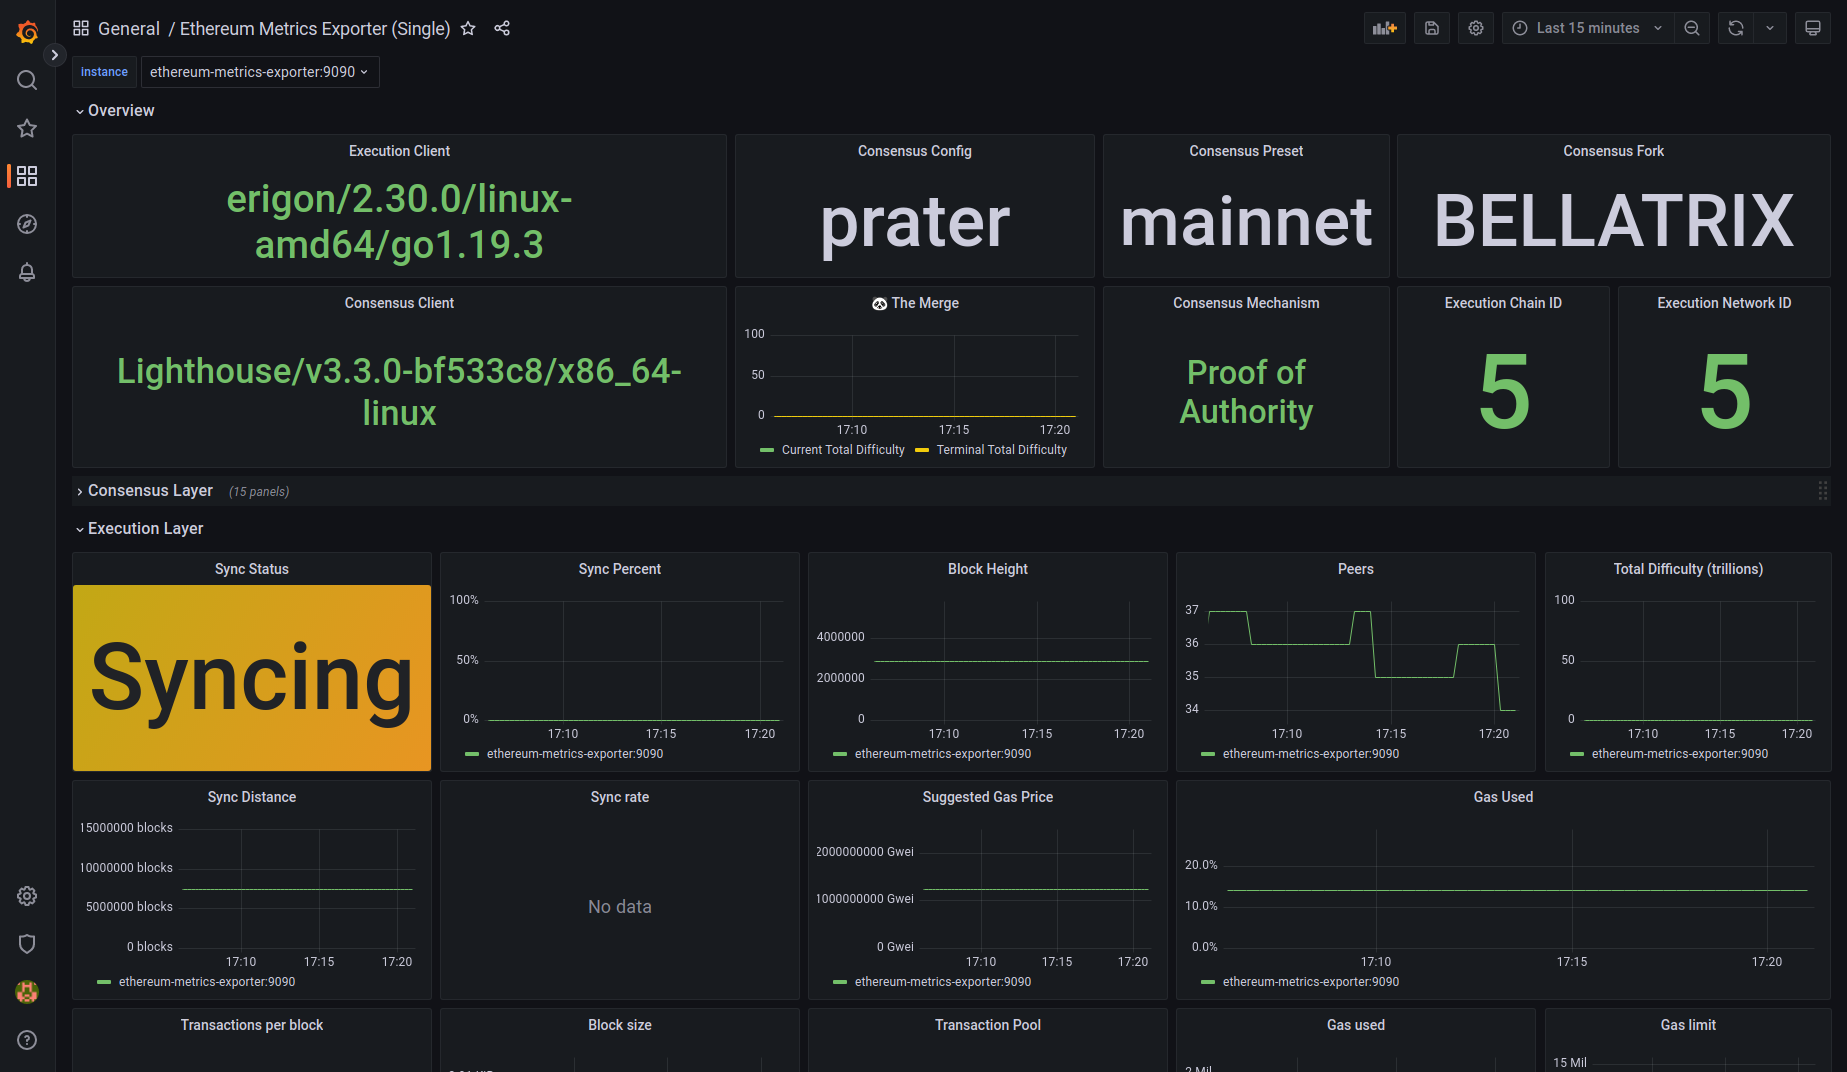
Any idea what is wrong?
Thanks for any help or direction. Greg.
@gregbkr you reading wrong log line. Here is the progress: [7/16 Execution] Executed blocks number=3016642 blk/s=23.2
I seem to be hitting the same issue syncing Goerli using latest devel . Here are the args I'm using:
--snapshots \
--port 30303 \
--chain goerli \
--torrent.port 42069 \
--http \
--http.addr 0.0.0.0 \
--http.port 8545 \
--http.vhosts localhost,dione \
--http.api eth,erigon,engine,net \
--http.timeouts.read 30s \
--http.timeouts.write 30m0s \
--http.timeouts.idle 2m0s \
--authrpc.addr 127.0.0.1 \
--authrpc.port 8551 \
--authrpc.vhosts localhost \
--authrpc.timeouts.read 30s \
--authrpc.timeouts.write 30m0s \
--authrpc.timeouts.idle 2m0s \
--private.api.addr 127.0.0.1:9090 \
--private.api.ratelimit 31872 \
'--log.console.verbosity' 'dbug' \
--datadir /var/lib/erigon-goerli
eth_blockNumber is reporting block 7499999:
{
    "id": "1",
    "jsonrpc": "2.0",
    "result": "0x7270df"
}
Tx pool stats are also reporting this block number: [txpool] stat block=7499999 pending=157 baseFee=0 queued=3755 alloc=920.9MB sys=1.5GB
CL layer looks to be integrating the latest header:
Jan 10 12:00:49 dione erigon-goerli-start[47443]: [DBUG] [01-10|12:00:49.494] [NewPayload] sending block               height=8287567 hash=0x05fab35f09244eaeb4d19c5f6987cd323f927709ffd30278ffd8ced04dcac680
Jan 10 12:00:49 dione erigon-goerli-start[47443]: [INFO] [01-10|12:00:49.494] [2/16 Headers] Handling new payload      height=8287567 hash=0x05fab35f09244eaeb4d19c5f6987cd323f927709ffd30278ffd8ced04dcac680
Jan 10 12:00:49 dione erigon-goerli-start[47443]: [DBUG] [01-10|12:00:49.494] [2/16 Headers] New payload begin verification
Jan 10 12:00:49 dione erigon-goerli-start[47443]: [DBUG] [01-10|12:00:49.494] [2/16 Headers] New payload verification ended success=true err=nil
Jan 10 12:00:49 dione erigon-goerli-start[47443]: [DBUG] [01-10|12:00:49.494] [2/16 Headers] DONE                      in=11.177653333s
Jan 10 12:00:49 dione erigon-goerli-start[47443]: [DBUG] [01-10|12:00:49.494] [NewPayload] got reply                   payloadStatus="{Status:ACCEPTED LatestValidHash:0x0000000000000000000000000000000000000000000000000000000000000000 ValidationError:<nil> CriticalError:<nil>}"
Jan 10 12:00:49 dione erigon-goerli-start[47443]: [DBUG] [01-10|12:00:49.835] [3/16 CumulativeIndex] DONE              in=340.716556ms
Jan 10 12:00:49 dione erigon-goerli-start[47443]: [DBUG] [01-10|12:00:49.835] [4/16 BlockHashes] DONE                  in=3.27µs
Jan 10 12:00:49 dione erigon-goerli-start[47443]: [DBUG] [01-10|12:00:49.835] [5/16 Bodies] DONE                       in=13.38µs
Jan 10 12:00:49 dione erigon-goerli-start[47443]: [DBUG] [01-10|12:00:49.835] [6/16 Senders] DONE                      in=84.729µs
Jan 10 12:00:49 dione erigon-goerli-start[47443]: [DBUG] [01-10|12:00:49.835] [7/16 Execution] DONE                    in=2.384µs
Jan 10 12:00:49 dione erigon-goerli-start[47443]: [DBUG] [01-10|12:00:49.835] [8/16 HashState] DONE                    in=2.402µs
Jan 10 12:00:49 dione erigon-goerli-start[47443]: [DBUG] [01-10|12:00:49.835] [9/16 IntermediateHashes] DONE           in=2.345µs
Jan 10 12:00:49 dione erigon-goerli-start[47443]: [DBUG] [01-10|12:00:49.835] [10/16 CallTraces] DONE                  in=2.523µs
Jan 10 12:00:49 dione erigon-goerli-start[47443]: [DBUG] [01-10|12:00:49.835] [11/16 AccountHistoryIndex] DONE         in=2.217µs
Jan 10 12:00:49 dione erigon-goerli-start[47443]: [DBUG] [01-10|12:00:49.835] [12/16 StorageHistoryIndex] DONE         in=1.76µs
Jan 10 12:00:49 dione erigon-goerli-start[47443]: [DBUG] [01-10|12:00:49.835] [13/16 LogIndex] DONE                    in=1.888µs
Jan 10 12:00:49 dione erigon-goerli-start[47443]: [DBUG] [01-10|12:00:49.835] [14/16 TxLookup] DONE                    in=28.337µs
Jan 10 12:00:49 dione erigon-goerli-start[47443]: [DBUG] [01-10|12:00:49.835] [15/16 WatchTheBurn] DONE                in=2.546µs
Jan 10 12:00:49 dione erigon-goerli-start[47443]: [DBUG] [01-10|12:00:49.835] [16/16 Finish] DONE                      in=1.869µs
The only unusual thing I can see in the logs is this entry which keeps being logged periodically:
[Downloader] Collecting... from=7382818 to=7382818 len=1
I'm also hitting this issue. External CL, prysm on mainnet. Both with and without snapshots.
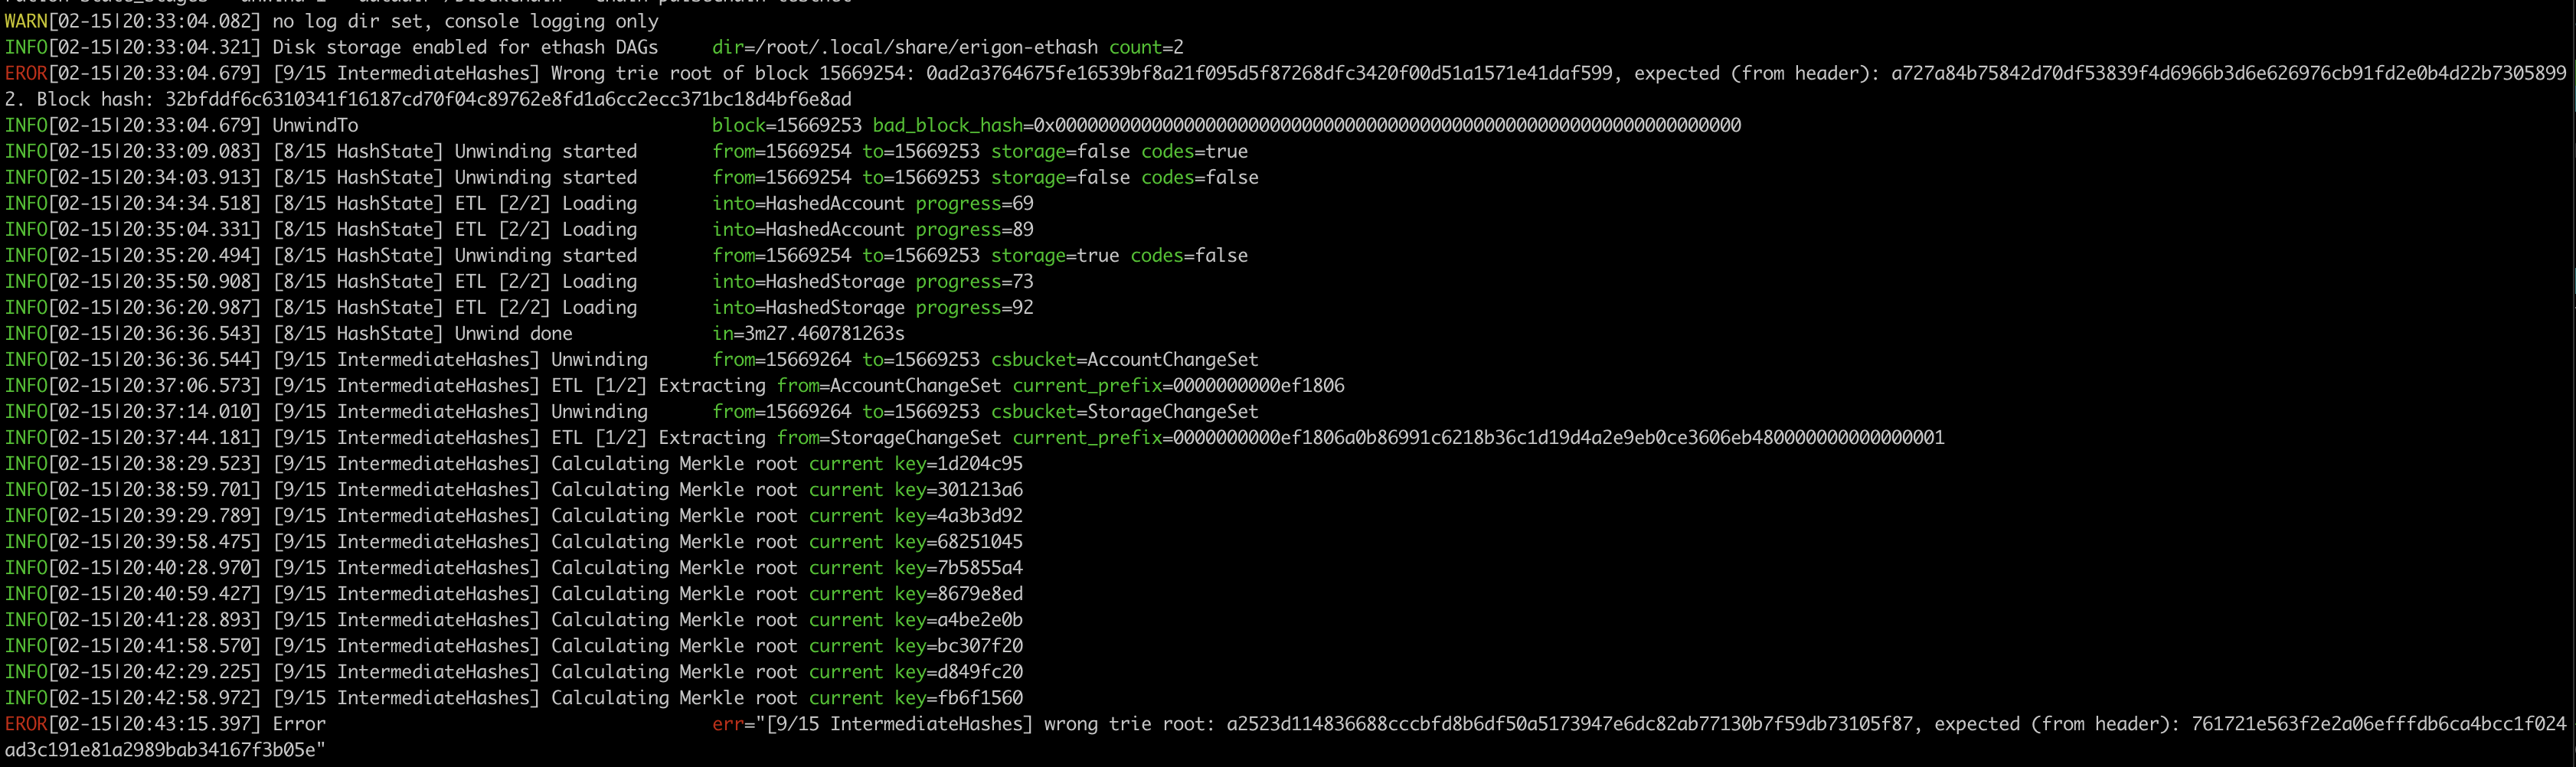
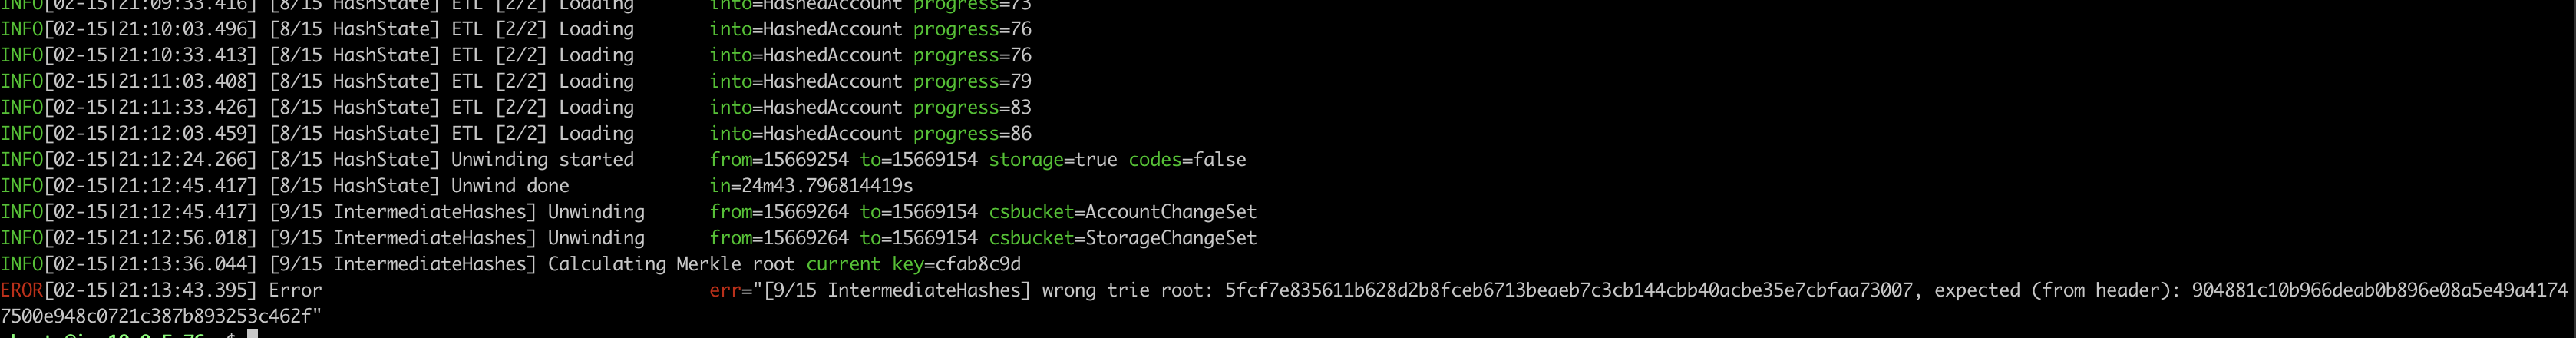
Headers seem correct but https://github.com/ledgerwatch/erigon/blob/devel/eth/stagedsync/stage_interhashes.go#L678 doesn't calculate the correct trie.
block 15669254 https://etherscan.io/block/15669254 has a root trie of 0xa727a84b75842d70df53839f4d6966b3d6e626976cb91fd2e0b4d22b73058992
block 15669253 https://etherscan.io/block/15669253 has a root trie of 761721e563f2e2a06efffdb6ca4bcc1f024ad3c191e81a2989bab34167f3b05e
 				 stage_at 	 prune_at
Snapshots 			 15669254 	 0
Headers 			 15669254 	 0
BlockHashes 			 15669254 	 0
Bodies 				 15669254 	 0
Senders 			 15669254 	 0
Execution 			 15669254 	 0
Translation 			 0 		 0
HashState 			 15669254 	 0
IntermediateHashes 		 15669264 	 0
AccountHistoryIndex 		 15669254 	 0
StorageHistoryIndex 		 15669254 	 0
LogIndex 			 15669254 	 0
CallTraces 			 15669254 	 0
TxLookup 			 15669254 	 0
Finish 				 15669254 	 0
--
prune distance:

blocks.v2: blocks=0, segments=0, indices=0

history.v3: false, idx steps: 0.00, lastMaxTxNum=0->1, lastBlockInSnap=0

sequence: EthTx=1763911786, NonCanonicalTx=83612

in db: first header 1, last header 15669254, first body 1, last body 15669254
I don't believe :-) it looks for me as goerli, or some other mess with 2 networks do you have other
ERORin logs?
He is syncing mainnet. The header trie root for that block matches mainnet and not goerli.
Goerli's trie root for that block number is 0xd08791989714a014b92fff86c8d9711d576e3547975274f48d2f28ffe3a3e738
Mainnet block 7499999
https://etherscan.io/block/7499999
This issue is stale because it has been open for 40 days with no activity. Remove stale label or comment, or this will be closed in 7 days.
This issue was closed because it has been stalled for 7 days with no activity.