apm-agent-python
 apm-agent-python copied to clipboard
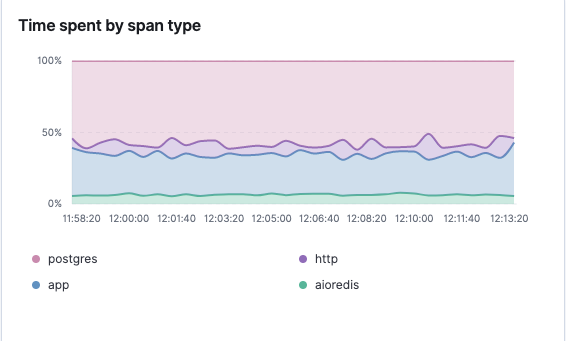
Time spent by span type to show external calls, not group on http
Is your feature request related to a problem? Please describe.
We work on microservice-based architecture where one service might be calling 3-4 other services. All these calls are getting logged in APM span but are grouped under http
Describe the solution you'd like If one service is calling 2 other services or some external API calls like google API etc then they must be a part of the graph that shows time spent by each span. The same information should be available at the transaction level as well to identify anomalies due to calls from internal or external calls.
Currently, there is no way to know which API call was responsible for increased response time. The same information is also not available at Kibana Lens since elastic APM does not bind the transaction name with the request but the transaction id.
Additional context
below is an example of a service that makes calls to 11 internal/external calls. But from the graph attached these all are grouped under HTTP. So far what I have understood is that calls are grouped under sub_type of a transacton.
Hey @ajay1mg! Yes, that's right, if an API call is done via HTTP, it generally gets the http sub type. There isn't currently a documented way to override this. One option would be to use a processor. You could check the request URL of each span, and replace the sub type with something more fitting if the URL matches some pattern (e.g. the hostname of a microservice).
There is the possibility that this could break some HTTP-specific display code in Kibana, so I'd give it a try in a development/staging system first.
@beniwohli I tried changing the value of subtype to the host but it still doesn't work. Here's what I tried:
@for_events(SPAN)
def my_processor(client, event):
    if event.get('subtype') == "http":
        event['subtype'] = event.get('context', {}).get('destination', {}).get('service', {}).get('resource')
    return event
I think there's more to it, probably change context key which has http?
'context': {
		'http': {
			'url': 'http://locahost:8200/hello',
			'status_code': 200
		},
		'destination': {
			'service': {
				'name': 'http://locahost:8200',
				'resource': 'locahost:443',
				'type': 'external'
			}
		}
	},
@beniwohli did you get a chance to review this? is there a way to deregister existing instrumentation and add custom instrumentation? We are using aiohttp for microservice calls and I want to use a custom one in place of this to override the subtype like in below example:
class AioHttpClientInstrumentation(AsyncAbstractInstrumentedModule):
    name = "aiohttp_client"

    instrument_list = [("aiohttp.client", "ClientSession._request")]

    async def call(self, module, method, wrapped, instance, args, kwargs):
        method = kwargs["method"] if "method" in kwargs else args[0]
        url = kwargs["url"] if "url" in kwargs else args[1]
        url = str(url)
        destination = url_to_destination(url)

        signature = " ".join([method.upper(), get_host_from_url(url)])
        url = sanitize_url(url)
        print(url, destination)
        transaction = execution_context.get_transaction()

        async with async_capture_span(
            signature,
            span_type="external",
            span_subtype="http://microservice.localhost.com",
            extra={"http": {"url": url}, "destination": destination},
            leaf=True,
        ) as span:
            leaf_span = span
            while isinstance(leaf_span, DroppedSpan):
                leaf_span = leaf_span.parent

            parent_id = leaf_span.id if leaf_span else transaction.id
            trace_parent = transaction.trace_parent.copy_from(
                span_id=parent_id, trace_options=TracingOptions(recorded=True)
            )
            headers = kwargs.get("headers") or {}
            self._set_disttracing_headers(headers, trace_parent, transaction)
            kwargs["headers"] = headers
            response = await wrapped(*args, **kwargs)
            if response:
                if span.context:
                    span.context["http"]["status_code"] = response.status
                span.set_success() if response.status < 400 else span.set_failure()
            return response
Hi @ajay1mg !
We started showing "service-to-service" and "service-to-backend" performance metrics broken down by destination.
This was introduced in a service overview page, it looks similar to this:

This isn't available per transaction view though, at least for now.
More details can be found here.
Just to add to this - in the latest 7.13 version we added ability to compare performance to historical (-24h or -7d) which includes comparisons for the service dependencies too.
Would that help solving your use case?