eclipse-plugins
 eclipse-plugins copied to clipboard
Setting breakpoint at Reset_Handler stalls in fpu init
Description
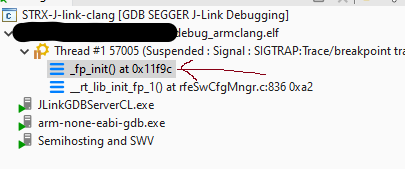
Setting a break point on Reset_Handler seems to stall at fpu init and not going to main using Jlink with cortex m7, however if I specify the program counter at the right address of the main , then I see the starting up going through. To illustrate this, I am setting a break point in my reset handler, as shown in below picture

The reset handler is defined as per
void Reset_Handler( void )
{

    rfeMPU_init();

    rfeSwStartup_enableFPU();

    main( 0, 0 );
}
What I observe is that the debugger seems to stall in the fpu init, hitting the resume button doesn't help and same debug message is printed in the Console ( beneath correspond to two clicks on resume button)
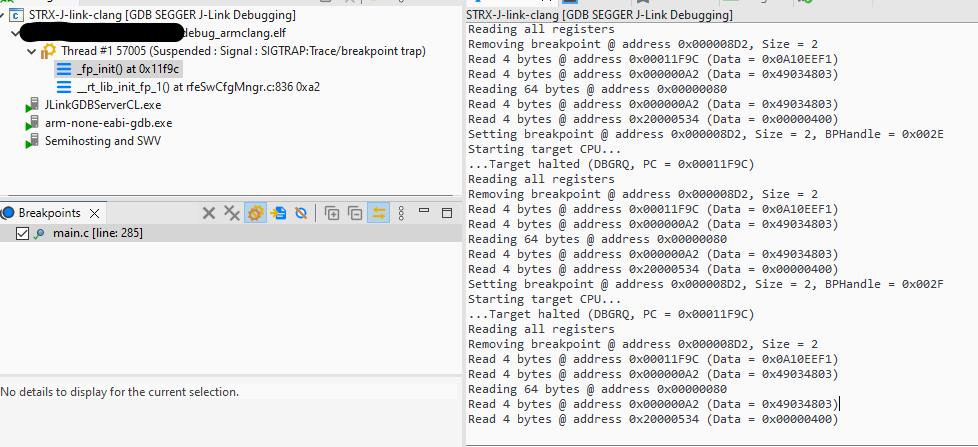
Setting breakpoint @ address 0x000008D2, Size = 2, BPHandle = 0x002D
Starting target CPU...
...Target halted (DBGRQ, PC = 0x00011F9C)
Reading all registers
Removing breakpoint @ address 0x000008D2, Size = 2
Read 4 bytes @ address 0x00011F9C (Data = 0x0A10EEF1)
Read 4 bytes @ address 0x000000A2 (Data = 0x49034803)
Reading 64 bytes @ address 0x00000080
Read 4 bytes @ address 0x000000A2 (Data = 0x49034803)
Read 4 bytes @ address 0x20000534 (Data = 0x00000400)
Setting breakpoint @ address 0x000008D2, Size = 2, BPHandle = 0x002E
Starting target CPU...
...Target halted (DBGRQ, PC = 0x00011F9C)
Reading all registers
Removing breakpoint @ address 0x000008D2, Size = 2
Read 4 bytes @ address 0x00011F9C (Data = 0x0A10EEF1)
Read 4 bytes @ address 0x000000A2 (Data = 0x49034803)
Reading 64 bytes @ address 0x00000080
Read 4 bytes @ address 0x000000A2 (Data = 0x49034803)
Read 4 bytes @ address 0x20000534 (Data = 0x00000400)
Am I configuring something wrongly?
Versions
- [plug-in version]
- [Eclipse version]
Eclipse IDE for C/C++ Developers (includes Incubating components) Version: 2022-06 (4.24.0) Build id: 20220609-1112 - [Java version] ```java version "1.8.0_201" Java(TM) SE Runtime Environment (build 1.8.0_201-b09) Java HotSpot(TM) 64-Bit Server VM (build 25.201-b09, mixed mode)
* [operating system] Windows 10

Please understand that without being able to reproduce the bug we cannot identify your problem.

---
Am I configuring something wrongly?
It is hard to say what is wrong.
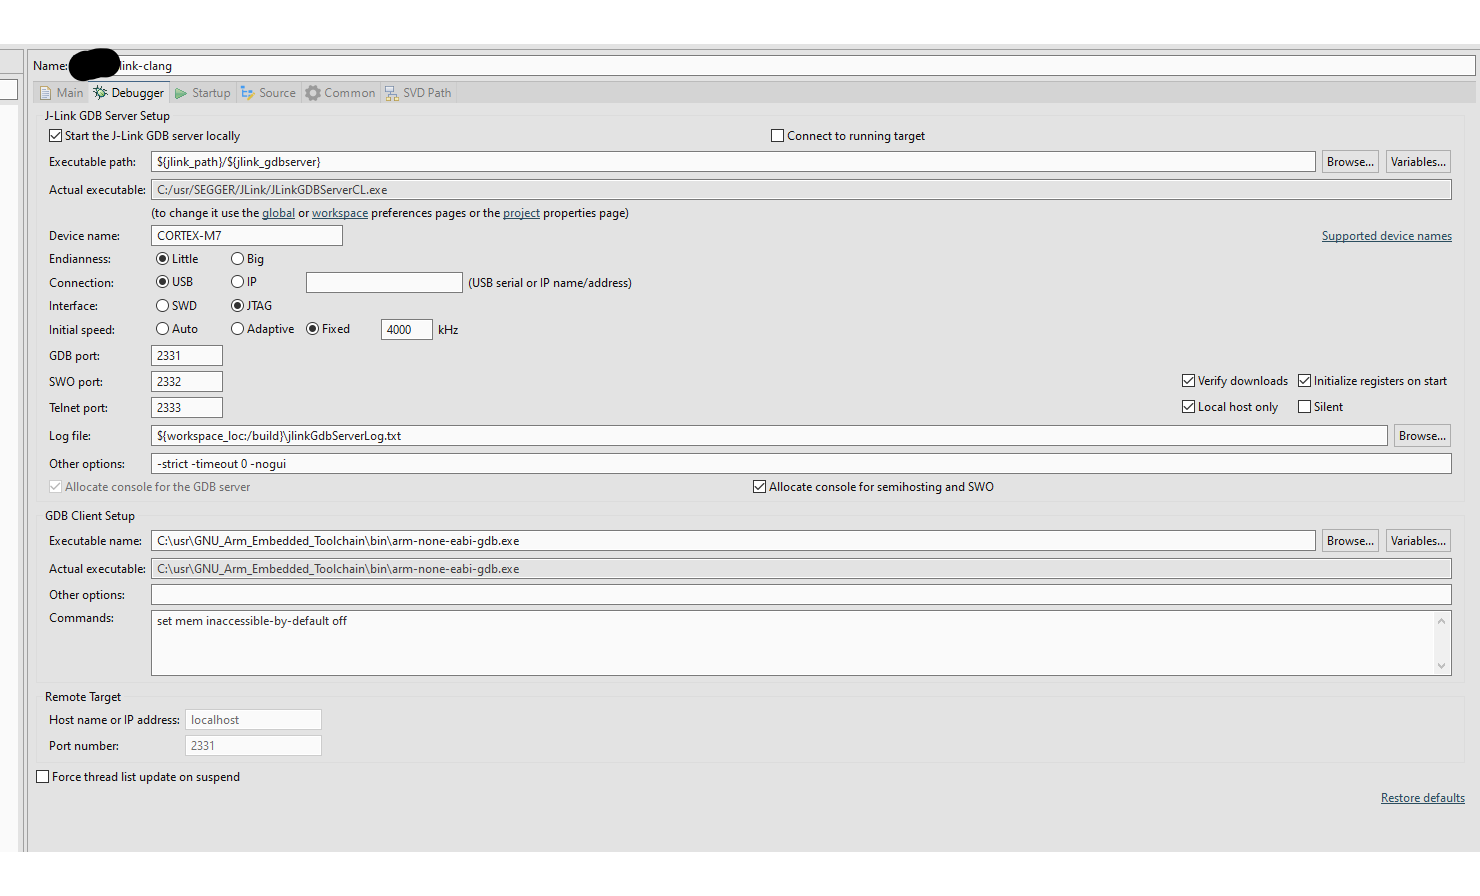
Can you also show the content of the Debugger tab?
As a general observation, although writing the Reset_Handler in C is theoretically possible, in certain conditions modern compiler do some optimisations and the resulting code is not functional.
Another recommendation, when debugging C code fails, switch to assembly mode, and try to understand the generated code.
Am I configuring something wrongly?
It is hard to say what is wrong.
Can you also show the content of the Debugger tab?
As a general observation, although writing the Reset_Handler in C is theoretically possible, in certain conditions modern compiler do some optimisations and the resulting code is not functional.
What debugger tab?
Another recommendation, when debugging C code fails, switch to assembly mode, and try to understand the generated code.
I do know what the code does, I got the PC from assembly and then it seems to work but not setting neither Reset_Handler nor main
What debugger tab?
The one between Main and Startup.
Sorry I don't know what you mean, I have put in the ticket the debugger stack already, that is the first thing that happens after flashing the board

@ilg-ul is referring to the Debugger tab in the debug launch configuration GUI.
https://rtist.hcldoc.com/help/index.jsp?topic=%2Forg.eclipse.cdt.doc.user%2Fgetting_started%2Fcdt_w_debug.htm
Description
Setting a break point on Reset_Handler seems to stall at fpu init and not going to main using Jlink with cortex m7, however if I specify the program counter at the right address of the main , then I see the starting up going through.
What does "specify the program counter at the right address of main" mean?
Do you mean that your program doesn't execute correctly if you put an initial breakpoint at Reset_Handler but does if you put the initial breakpoint at main()?
Is the whole program in and executing from flash?
If you're flashing the program using some flash tool before debugging and then debugging it from flash then why do you have the debug launch configuration loading the executable to the target at debug startup?
Is there any relocation/copying of code from flash to RAM during the program initialization?
Is Reset_Init your only startup code? Is there nothing else? For example to initialize BSS/zero init memory, heap (if used), copy static initialized data etc.?
You need to provide more details and info about your project and debug launch configuration etc. in order for others to offer useful suggestions.
@ilg-ul is referring to the Debugger tab in the debug launch configuration GUI.
https://rtist.hcldoc.com/help/index.jsp?topic=%2Forg.eclipse.cdt.doc.user%2Fgetting_started%2Fcdt_w_debug.htm
Ok, clear, thanks!
the debugger seems to stall in the fpu init
What does this mean? Did you single step the assembly code?
Description
Setting a break point on Reset_Handler seems to stall at fpu init and not going to main using Jlink with cortex m7, however if I specify the program counter at the right address of the main , then I see the starting up going through.
What does "specify the program counter at the right address of main" mean?
It means that if I go to Startup >> Ru/Restart Commands and I fill in the box of Set Program counter at (hex) with the program counter of my application, which I obtain looking at the assembly code addresses; then, after rebooting I see who the debug trace shows the program breaking at the main as I expect.
Do you mean that your program doesn't execute correctly if you put an initial breakpoint at
Reset_Handlerbut does if you put the initial breakpoint atmain()?
Nope, in both cases the the inital breakpoint is not pointing to the right code section, it is breaking at Target halted (DBGRQ, PC = 0x00011F9C) which is the address of the init of the FPU in my cortex-m7
Is the whole program in and executing from flash? If you're flashing the program using some flash tool before debugging and then debugging it from flash then why do you have the debug launch configuration loading the executable to the target at debug startup? Is there any relocation/copying of code from flash to RAM during the program initialization? Is
Reset_Inityour only startup code? Is there nothing else? For example to initialize BSS/zero init memory, heap (if used), copy static initialized data etc.?
Yes, I am flashing it with Jlink as described in the documentaion, for defining the areas of memory I am using this scatter file for clang
; File: startup_ARM_CLANG_CM7.S
; Purpose: startup file for Cortex-M7 devices. Should use with
;   ARM CLANG (ARMCC) for ARM Embedded Processors
; Version: V1.0
; Date: 19 April 2021
;

 PRESERVE8
 THUMB

 IMPORT   ||Image$$ARM_LIB_STACK$$ZI$$Limit||

; Vector Table Mapped to Address 0 at Reset

                AREA    vectors, DATA, READONLY
                EXPORT  __Vectors
                EXPORT  __Vectors_End
                EXPORT  __Vectors_Size
; import C handlers: make sure to comment out the matching asm version below
				IMPORT  Reset_Handler
				IMPORT  NMI_Handler
				IMPORT  HardFault_Handler
				IMPORT  MemManage_Handler
				IMPORT  BusFault_Handler
				IMPORT  UsageFault_Handler
				IMPORT  SVC_Handler
				IMPORT  DebugMon_Handler
				IMPORT  PendSV_Handler
				IMPORT  SysTick_Handler
				IMPORT  Default_Handler

__Vectors       DCD     ||Image$$ARM_LIB_STACK$$ZI$$Limit|| ; Top of Stack
	 DCD Reset_Handler         ; Reset Handler ;
	 DCD NMI_Handler           ; NMI Handler ;
	 DCD HardFault_Handler     ; Hard Fault Handler ;
	 DCD MemManage_Handler     ; MPU Fault Handler ;
	 DCD BusFault_Handler      ; Bus Fault Handler ;
	 DCD UsageFault_Handler    ; Usage Fault Handler ;
	 DCD 0                     ; Reserved ;
	 DCD 0                     ; Reserved ;
	 DCD 0                     ; Reserved ;
	 DCD 0                     ; Reserved ;
	 DCD SVC_Handler           ; SVCall Handler ;
	 DCD DebugMon_Handler      ; Debug Monitor Handler ;
	 DCD 0                     ; Reserved ;
	 DCD PendSV_Handler        ; PendSV Handler ;
	 DCD SysTick_Handler       ; SysTick Handler ;

 ; External interrupts ;
	 DCD Default_Handler

__Vectors_End
__Vectors_Size  EQU     __Vectors_End - __Vectors   ; Max = (16+68)*4 = 336B


 AREA   |.text|, CODE, READONLY

;Reset_Handler	PROC
;                EXPORT  Reset_Handler             [WEAK]
;                IMPORT  main
;		MOVS	R0, #0
;                LDR     R1, =main
;                BX      R1
;                ENDP
;NMI_Handler     PROC
;                EXPORT  NMI_Handler               [WEAK]
;                B       .
;                ENDP
;
;HardFault_Handler PROC
;                EXPORT  HardFault_Handler         [WEAK]
;                B       .
;                ENDP
;
;MemManage_Handler PROC
;                EXPORT  MemManage_Handler         [WEAK]
;                B       .
;                ENDP
;
;BusFault_Handler PROC
;                EXPORT  BusFault_Handler          [WEAK]
;                B       .
;                ENDP
;
;UsageFault_Handler PROC
;                EXPORT  UsageFault_Handler        [WEAK]
;                B       .
;                ENDP
;
;SVC_Handler     PROC
;                EXPORT  SVC_Handler               [WEAK]
;                B       .
;                ENDP
;
;DebugMon_Handler PROC
;                EXPORT  DebugMon_Handler          [WEAK]
;                B       .
;                ENDP
;
;PendSV_Handler  PROC
;                EXPORT  PendSV_Handler            [WEAK]
;                B       .
;                ENDP
;
;SysTick_Handler PROC
;                EXPORT  SysTick_Handler              [WEAK]
;                B       .
;                ENDP
;
;Default_Handler PROC
;                EXPORT  Default_Handler              [WEAK]
;                B       .
;                ENDP
;
;              ALIGN

 END
You need to provide more details and info about your project and debug launch configuration etc. in order for others to offer useful suggestions.
You haven't explained important details about your program that I asked about. Flash Vs RAM memory layout, relocation/copying, startup code etc. Without detailed info we're all just guessing.
E.g. why are you using hex PC values for breakpoints instead of symbolic names such as main? That doesn't make sense to me.
And, as ever, creating a minimal reproducible test case that you could just share in full (whole project) would be ideal.
the debugger seems to stall in the fpu init
What does this mean? Did you single step the assembly code?
Not needed, as you see in the debugger trace the address is already shown there
You haven't explained important details about your program that I asked about. Flash Vs RAM memory layout, relocation/copying, startup code etc. Without detailed info we're all just guessing.
I mentioned above that I was using Flash and I have shared the scatter file I use.
E.g. why are you using hex PC values for breakpoints instead of symbolic names such as
main? That doesn't make sense to me.
This is exactly the point, I want to use the symbolic name main, but after the .elf is loaded on the M7, this main is not pointing to my expected main which is defined in reset handler function that I shared but it starts at the FPU init
And, as ever, creating a minimal reproducible test case that you could just share in full (whole project) would be ideal.
Not needed, as you see in the debugger trace the address is already shown there
If you think that the address is enough, then you should be able to figure yourself why the program crashed.
the debugger seems to stall in the fpu init
What does this mean? Did you single step the assembly code?
Not needed, as you see in the debugger trace the address is already shown there
What happens if you debug/single instruction step from the very start of your program? That is, don't use a breakpoint at all and don't let the debugger run the program at startup.
If your symbolic info is not matching the program in memory then you probably have some issue with the project build itself.
Again it's difficult to comment usefully with only bits of info.
Thanks for the pointers, I will take a look into the reset_init as you mentioned above. I am sure that the project build is fine and the image too, because I have tried exactly same build environment and .elf with Lauterbach + Lauterbach eclipse plugin and there it works correctly. So it breaks at main when I set the break point there at start
Just to recap, things that I would look at:
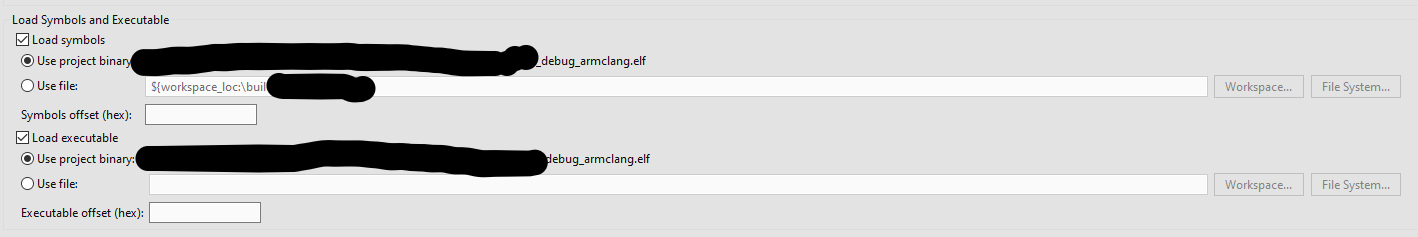
- If the program is being programmed to flash before debugging then remove the load of the program to the target from the debug launch configuration. At best it's unnecessary but at worst it could cause problems if the debugger attempts to do normal memory writes to a flash area of the memory map.
- Check the symbolic info using a map or list file or even by just printing using the GDB console interface. For example,
p/x mainandp/x Reset_Handler. - Remove the continue from the debug launch configuration, don't set any breakpoint, and single step from the very start to see where/how/why execution fails.
- Double check that, if you're debugging the program from flash, that the debugger is not trying to use soft breakpoints (where it saves the breakpoint instruction and temporarily overwrites it with a
BKPTinstruction - something that will generally not work directly with flash) but is using hardware breakpoints. - Check all debugging logs for any errors/anomalies.
Just to recap, things that I would look at:
1. If the program is being programmed to flash before debugging then remove the load of the program to the target from the debug launch configuration. At best it's unnecessary but at worst it could cause problems if the debugger attempts to do normal memory writes to a flash area of the memory map.
Do you mean in here?
2. Check the symbolic info using a map or list file or even by just printing using the GDB console interface. For example, `p/x main` and `p/x Reset_Handler`.
How/where to check the symbolic info if not using GDB print? Via assembly step?
Thanks @TommyMurphyTM1234 for all the suggestions!
Do you mean in here?
Yes. If the program is already in flash and being run/debugged from there then the debugger should not be trying to load it to the target. Uncheck the Load executable option.
How/where to check the symbolic info if not using GDB print? Via assembly step?
As I said already, list/map files, and maybe also using the nm binutil (if you're using a GCC toolchain - other toolchains should have an equivalent tool).
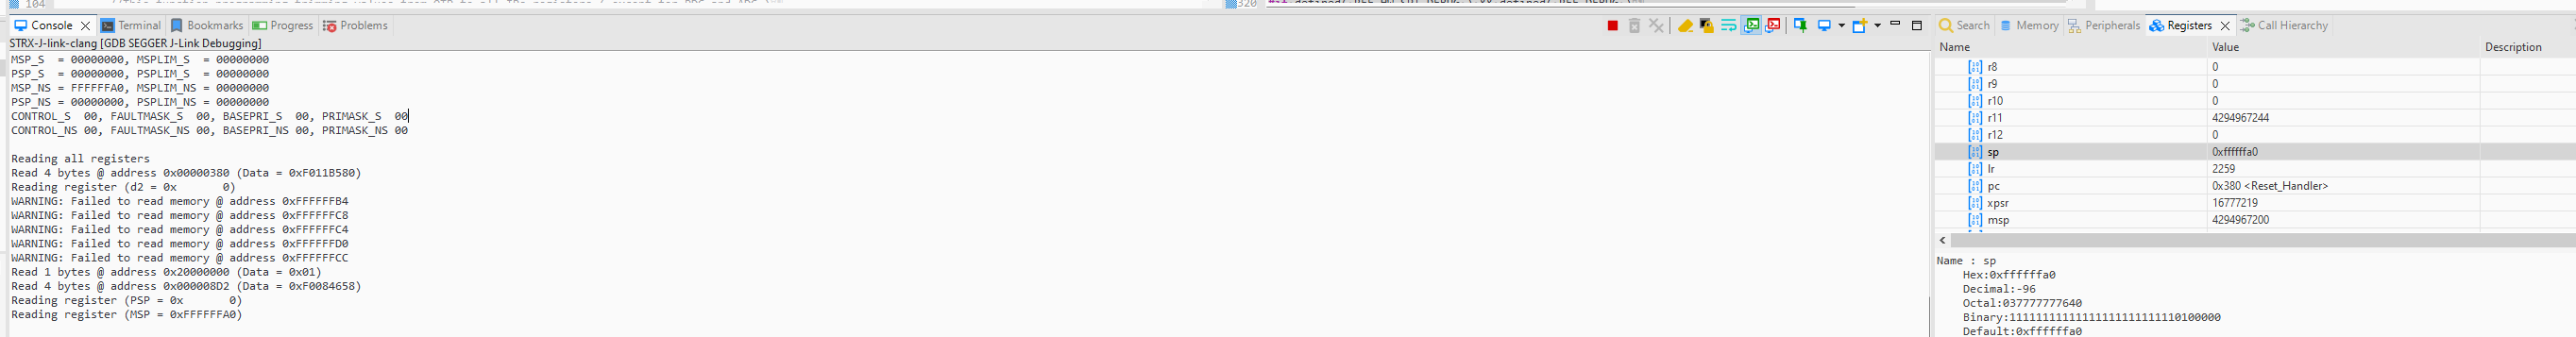
Hi @TommyMurphyTM1234 @ilg-ul one question, where/how does Eclipse Embedded set the stack Pointer?
I am seeing this but that address is invalid
 since my address ranges are
<MemMap>
  <CoreRunning>
      <Range Start="0x00000000" Size="0x20000" Zone="Default"/>
      <Range Start="0x20000000" Size="0x7FF8" Zone="Default"/>
    </CoreRunning>
    <CoreHalted>
      <Range Start="0x00000000" Size="0x20000" Zone="Default"/>
      <Range Start="0x20000000" Size="0x7FF8" Zone="Default"/>
    </CoreHalted>
</MemMap>
Hi @TommyMurphyTM1234 @ilg-ul one question, where/how does Eclipse Embedded set the stack Pointer?
It doesn't. Cortex-M CPUs do this automatically.
At startup/post reset they load $sp with $VTOR[0] and $pc with $VTOR[4].
Some (early?) cores don't have a $VTOR in which case it's effectively 0x00000000.
VTOR = Vector Table Offset Register.
- https://developer.arm.com/documentation/ka001146/latest
- https://embetronicx.com/tutorials/microcontrollers/stm32/reset-sequence-in-arm-cortex-m4/amp/
Some (early?) cores don't have a $VTOR in which case it's effectively 0x00000000
ARM-v6m (Cortex-M0/M0+) cores do not implement VTOR.
Some (early?) cores don't have a $VTOR in which case it's effectively 0x00000000
ARM-v6m (Cortex-M0/M0+) cores do not implement
VTOR.
Thanks @ilg-ul - couldn't remember offhand. 🙂
Hi @TommyMurphyTM1234 @ilg-ul one question, where/how does Eclipse Embedded set the stack Pointer?
It doesn't. Cortex-M CPUs do this automatically. At startup/post reset they load
$spwith$VTOR[0]and$pcwith$VTOR[4]. Some (early?) cores don't have a$VTORin which case it's effectively0x00000000.VTOR = Vector Table Offset Register.
* https://developer.arm.com/documentation/ka001146/latest

* https://embetronicx.com/tutorials/microcontrollers/stm32/reset-sequence-in-arm-cortex-m4/amp/
Thanks! And what happens if the application is only in RAM is the same? I am wondering how the SP is pointing to 0xffffffd8 and why
what happens if the application is only in RAM
The debugger starts from the entry point, usually defined in the linker script.
So if my .ld file has this
 * Need modifying for a specific board.
 *   ITCM.ORIGIN: starting address of flash
 *   ITCM.LENGTH: length of flash
 *   DTCM.ORIGIN: starting address of RAM bank 0
 *   DTCM.LENGTH: length of RAM bank 0
 */
MEMORY
{
  ITCM (rx) : ORIGIN = 0x0, LENGTH = 0x20000 /* 128K */
  DTCM (rwx) : ORIGIN = 0x20000000, LENGTH = 0x7FF8 /* 8K */
}

/* Linker script to place sections and symbol values. Should be used together
 * with other linker script that defines memory regions ITCM and DTCM.
 * It references following symbols, which must be defined in code:
 *   Reset_Handler : Entry of reset handler
 *
 * It defines following symbols, which code can use without definition:
 *   __exidx_start
 *   __exidx_end
 *   __copy_table_start__
 *   __copy_table_end__
 *   __zero_table_start__
 *   __zero_table_end__
 *   __etext
 *   __data_start__
 *   __preinit_array_start
 *   __preinit_array_end
 *   __init_array_start
 *   __init_array_end
 *   __fini_array_start
 *   __fini_array_end
 *   __data_end__
 *   __bss_start__
 *   __bss_end__
 *   __end__
 *   end
 *   __HeapLimit
 *   __StackLimit
 *   __StackTop
 *   __stack
 */
ENTRY(Reset_Handler)
...
It should go to the Reset_Handler right?
It should go to the
Reset_Handlerright?That's correct.
Then I don't understand why the hack the SP is pointing to that value XD
EDIT: I see that as parameters to GDB client setup by default I have set mem inaccessible-by-default off shouldn't this be set to set mem inaccessible-by-default on?
I don't understand why the hack the SP is pointing to that value
Because your program crashed.