deepTools
 deepTools copied to clipboard
heatmap - name and position of gene of itnerest
Dear all,
For my data set, I am interested how it looks over TSS throughout different chromosome, however once I got the result I noticed some regions really pop out (in blue on the example shown below). And I would like to know what are those TSS exactly. Is it possible to extract information and if yes how?
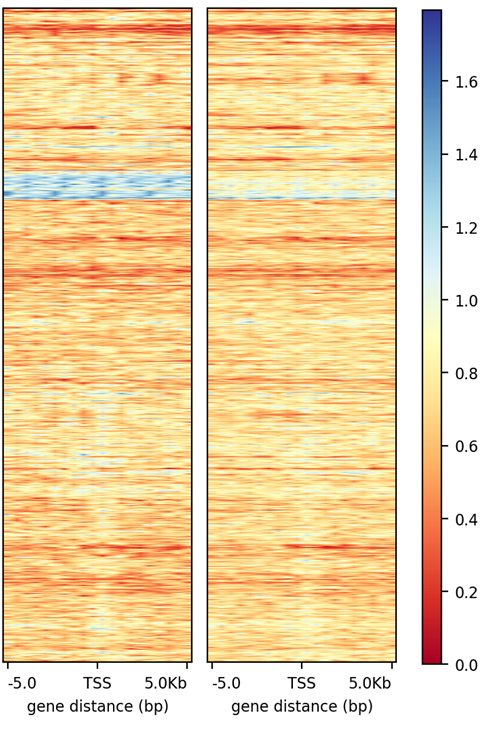
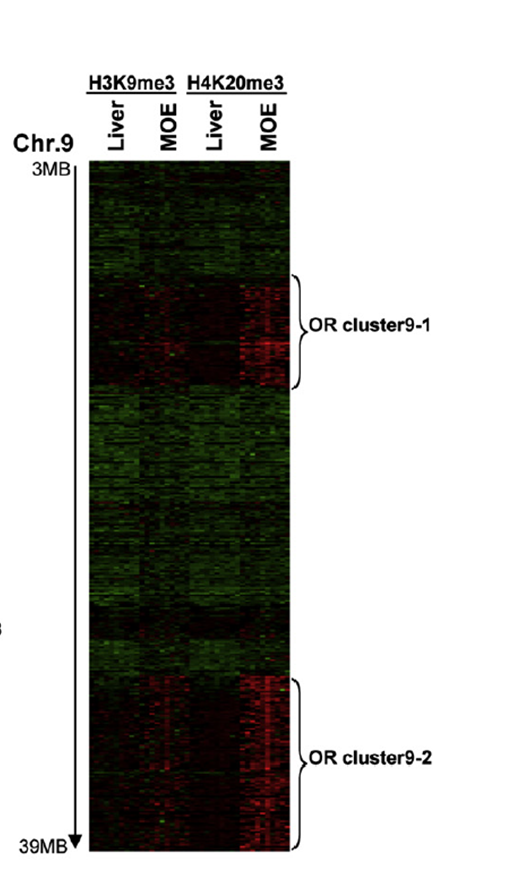
Also for a different question that I have I would like to get position on the heatmap of my gene(s) of interest (example provided below), eg. adding a gene label/name on a heatmap, is that possible and if yes how?
 Thank you,
Regards,
Maja
Thank you,
Regards,
Maja
The .mat.gz file that's used as input into plotHeatmap is just a compressed text file that's (more or less) human readable. I'm pretty sure the name of the feature is present on each line in there.
Regarding your second question, you can't print labels for each row in the heatmap. Unless you only have a few genes/transcripts/etc. the labels would be too small to be readable (we typically don't even print each row in the heatmap, since it's smaller than a pixel!). What you can do is specify multiple region files when you run compute matrix. Have a look here for an example: https://deeptools.readthedocs.io/en/develop/content/tools/plotHeatmap.html#usage-examples