deepTools
 deepTools copied to clipboard
Keep the same number of rows in heatmap
Welcome to deepTools GitHub repository! Before opening the issue please check that the following requirements are met :
-
[x] Search whether this issue (or a similar issue) has been solved before using the search tab above. Link the previous issue if appropriate below.
-
[x] Paste your deepTools version (
deeptools --version) and your python version (python --version) below. deeptools 3.5.1 python 3.8.8 -
[x] Paste the full deepTools command that produces the issue below (ignore if you simply spotted the issue in the code/documentation).
grep -f target.txt -F annotation.gtf > target.gtf grep -f nontarget.txt -F annotation.gtf > non_target.gtf computeMatrix scale-regions -p 20 -S GRCh38.bigwig -R target.gtf non_target.gtf --beforeRegionStartLength 112000 --regionBodyLength 120000 --afterRegionStartLength 112000 --skipZeros -o target_background.gz plotHeatmap -m target_background.gz -out target_background.png
- [x] Paste the output printed on screen from the command that produces the issue
below (ignore if you simply spotted the issue in the code/documentation).
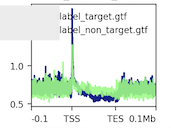
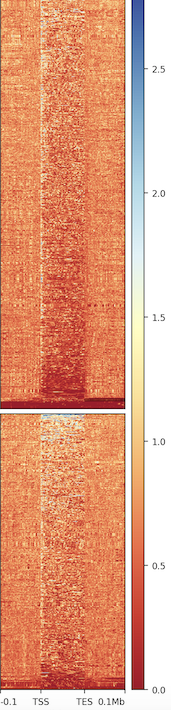
I have two groups of genes - target and non-target genes. These two groups of genes have the same group size. I filter the GTF file I downloaded from 10X genomic by the groups of genes. After I generate the figure, I notice that these two groups have different number of rows in the heatmap. My question is:
- Why it would lead to different number of rows even I use the same number of genes in both group? What's the row in the heatmap? How could I make both of them the same?
- Does the different number of rows change the density plot at top? aka it's not showing the real difference, just because they have different rows.
Thank you!
You skipped zeros, that could be a cause. Rows are genes, but you skipped the genes where you had no signal on them.
It actually looks the same after I remove the skip_zero argument computeMatrix scale-regions -p 20 -S GRCh38.bigwig -R target.gtf non_target.gtf --beforeRegionStartLength 112000 --regionBodyLength 120000 --afterRegionStartLength 112000 -o target_background.gz plotHeatmap -m target_background.gz -out target_background.png
Is each row on the heatmap corresponding to a line in GTF? Although the gene groups have the equal number, but the filtered GTF would have different row number due to other features in GTF, such as CDS, exon, intron, etc.