lovelace-plotly-graph-card
 lovelace-plotly-graph-card copied to clipboard
Published
20 hours ago •
 dbuezas
Issue with "autorange_after_scroll" when using an arbitrary function
trafficstars
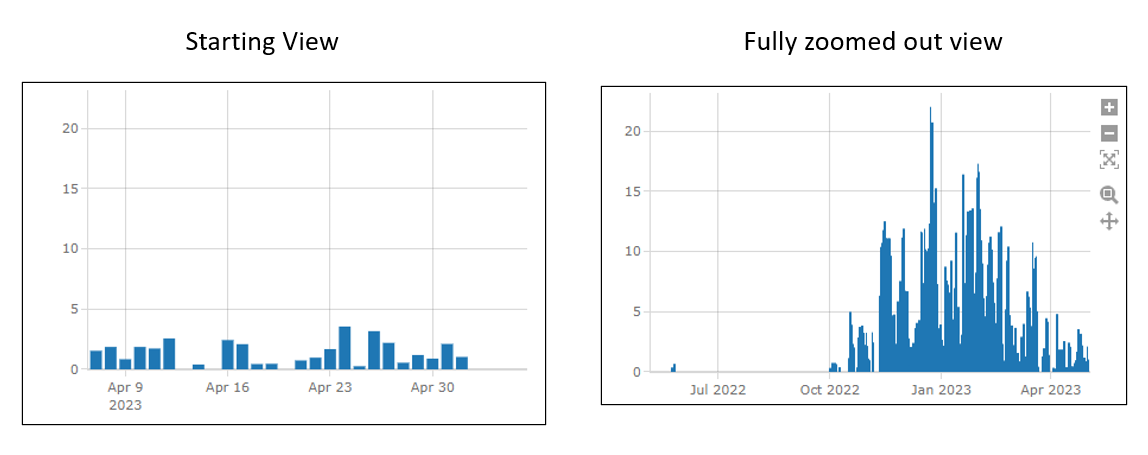
The "autorange_after_scroll" function does not seem to work correctly when I use an arbitrary function to define different X and Y values (put new values into xs and ys. It scales the largest Y axis to the largest Y value in the data.
If I only change the return xs and ys to return the orginal xs and ys and nothing else, it seems to work fine. So maybe there is something wrong with the data I am passing, but it seems to display fine and I can't see a difference when I debug.
Displayed Graphs
Debug Data

- type: custom:plotly-graph
  hours_to_show: 1M
  autorange_after_scroll: true
  defaults:
    yaxes:
      side: left
      overlaying: "n"
      visible: true
      showgrid: true
  entities:
    - entity: sensor.yearly_downstairs_heat
      type: bar
      filters:
        - fn: |-
            ({xs, ys, hass}) => {
              let xx = [];
              let yy = [];
              for (const [key, value] of Object.entries(hass.states["sensor.yearly_downstairs_heat"].attributes)) {
                  let d = new Date(key);
                  d.setMinutes(d.getMinutes());
                  if (d > 0){
                      xx.push(d);
                      yy.push(value);
                  }
              }
              return {
                xs: xx,
                ys: yy
              };
            }
        - fn: |-
            ({xs, ys}) => {
              console.log([i,xs,ys,x,y]);
            }