visNetwork
 visNetwork copied to clipboard
Published
20 hours ago •
 datastorm-open
Can I add a color scale strip to an existing plot?
I would like to add a color scale strip to an existing plot with visNetwork() .
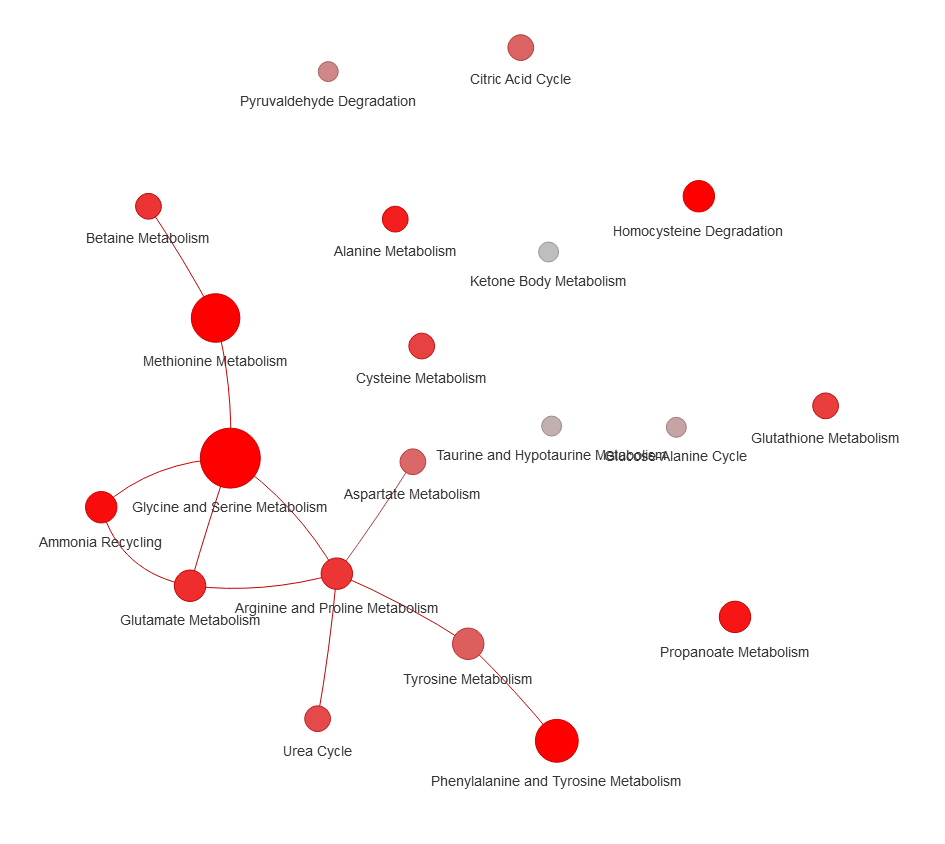
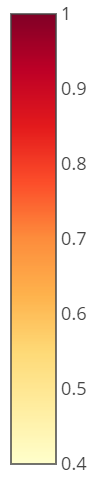
Here I mapped some floating values to the color. In this case rich red is almost zero, light gray is almost 1. And I would like to add a color scale strip (like this) to the above network.
Is there any way to add this color scale to visNetwork?
Thank you for your comment. If I can be of any assistance, please let me know.