react-d3-graph
 react-d3-graph copied to clipboard
Graph position and fit to view
Hi there :),
Doing some research from the past week on this package. Is there any feature available for the Graph to fit view. Even it should support drag and drop also. Please refer below image
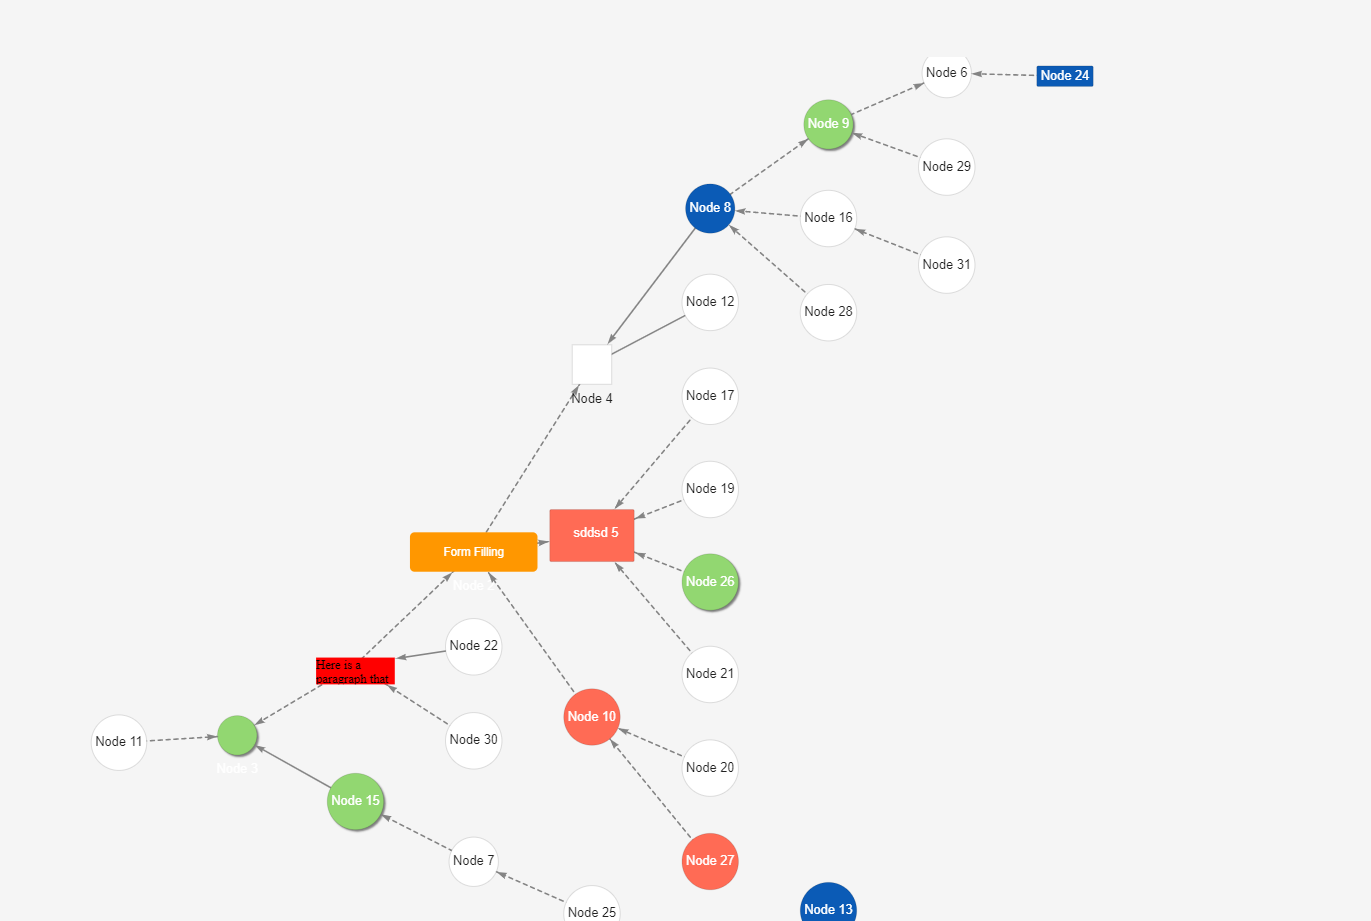
Is there any way to achieve this?
Hi @onlyreddy
Is there any feature available for the Graph to fit view.
Could you elaborate a bit on what "fit view" means for you? Do you intend to have the graph bounded to the view box? Would this be what you're looking for?
Fit view means suppose if user expanded 100 nodes and some of them may move out of the viewport. But somehow I need to fit them inside my viewport. So that user can see all nodes.
I saw the PR was approved but is it included in the latest release?
There is a dirty way to do this by modified the translation of graph initialZoom as 1.
 document
      .getElementById('info-map-graph-container-zoomable')
      .setAttribute('transform', `translate(0,0), scale(1)`);

    setConfiguration({
      ...configuration,
      initialZoom: 1,
    });
Above one is working for me.
@onlyreddy I've found a way to center and fit the graph based on the size/scale.
export const Graph = () => {
  const graphRef = React.useRef<any>();

  const centerGraph = () => {
    ...
    const wrapper = d3.select(`#${graphRef.current.state.id}-graph-wrapper`);

    const zoom = d3
      .zoom()
      .scaleExtent([
        graphRef.current.state.config.minZoom,
        graphRef.current.state.config.maxZoom,
      ]);

    const svg = d3.select(`svg`);
    const g = d3.select(
      `#${graphRef.current.state.id}-graph-container-zoomable`
    );

    zoom.on('zoom', () => {
      g.attr('transform', d3.event.transform);
    });
    wrapper.call(zoom).on('dblclick.zoom', null);

    const bbox = g.node().getBBox();
    const width = graphRef.current.state.config.width;
    const height = graphRef.current.state.config.height;

    const scale = Math.min(width / bbox.width, height / bbox.height);
    const translateX = (width - bbox.width * scale) / 2 - bbox.x * scale;
    const translateY = (height - bbox.height * scale) / 2 - bbox.y * scale;

    const transform = d3.zoomIdentity
      .translate(translateX, translateY)
      .scale(scale);

    svg.on('.zoom', null);
    svg.transition().duration(750).call(zoom.transform, transform);
    svg.call(zoom);
  };

  React.useEffect(() => {
    graphRef.current &&
      setTimeout(() => {
        centerGraph();
      }, 2000);
  }, [graphRef]);

  return (
    <D3Graph
      id="graph-id"
      data={data}
      config={config}
      ref={graphRef}
    />
  );
}

export default Graph;
The centerGraph could be also used in a button, it's working for me.