Chart.js
 Chart.js copied to clipboard
includeBounds doesn't work for linear axes
Expected behavior
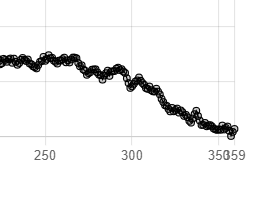
When scales[scale].ticks.includeBounds is set to false, I expect to not see the last bound tick value.
Current behavior
The last tick is visible and is overlapping the previous tick.
Reproducible sample
https://codesandbox.io/s/chart-js-includebounds-doesnt-work-for-linear-axes-vbps8
Optional extra steps/info to reproduce
No response
Possible solution
No response
Context
No response
chart.js version
v3.7.0
Browser name and version
Chrome 97
Link to your project
No response
This is because the the bounds are considered to be "nice" when originating from data. I agree this does not behave well, but I'm not sure it can or should be changed as a bug fix.
I have the opposite problem. My data has zero values at the end, but no amount of configuration can successfully force Chart.js to actually show a tick on the x axis at the max bound.
I don't care what the data says, I want the same amount of control for the x axis as the documentation shows for the y axis.