chartist
 chartist copied to clipboard
Time Series Labels
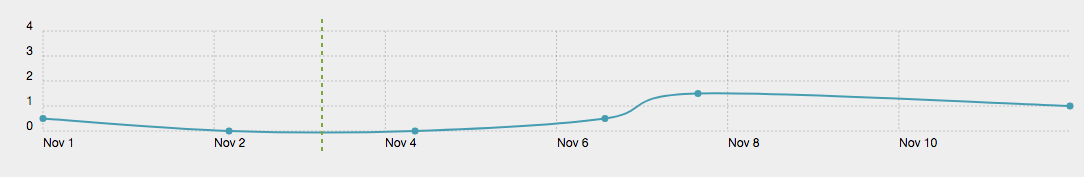
I'm plotting data points for a series of dates and letting Chartist calculate the x-axis labels since the date range can vary depending on the data. The problem is that Chartist isn't plotting the labels at exactly YYYY-MM-DD 00:00:00, so it appears that the data isn't in the correct position (although it is). The labels are correct, but since they are just showing the month and day and not the exact time it looks weird. Is there an easy way to ensure that the labels are at exactly midnight on the day without having to plot each and everyone manually?
The first data point is at 2017-11-01 00:00:00, the second is at 2017-11-03 00:00:00. The "Nov 2" label is correct since it still falls within the range of where the 2nd is, but it looks wrong because it is so close to the 3rd. It essentially makes it looks like Nov 2nd starts there instead.
Use the fixedscaleaxis and provide ticks manually. Check the gettingstarted switch axis type section. Cheers
I wish that were an actual option, but it isn't. These graphs are calculated dynamically and the dates can change. I'll see if I can hack it somehow.
I guess using FixedScaleAxis is your only option at the moment. A time series axis is planned for Chartist 1.0