grafana-prometheus-alertmanager-datasource
 grafana-prometheus-alertmanager-datasource copied to clipboard
Grafana 8.4.4] After grafana upgrade Alertmanager datasource started behaving strange. One time displaying alarm annotation next time labels
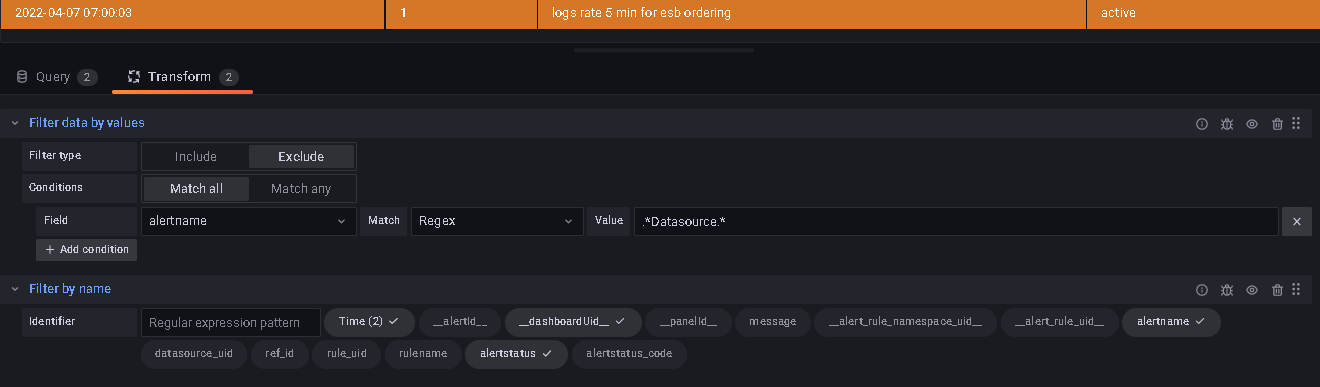
After upgrade from 7.5.0 to 8.4.4 alert manager data source (camptocamp-prometheus-alertmanager-datasource) started to behave differently. It used to show only alarm labels as a table but now started rotating in time showing alarm labels or annotations. I cannot catch why and at what interval or how to control it.
Labels:
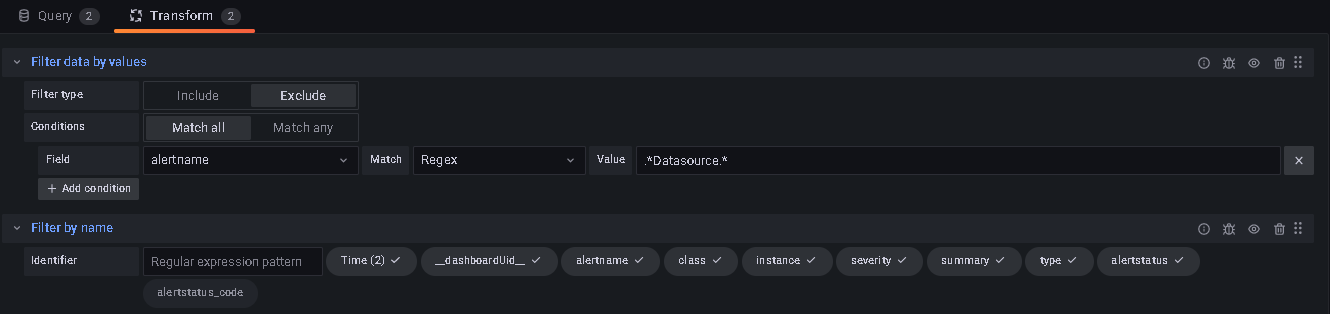 Annotations:
Any ideas?or recommendations?
Hi @tahchiev, I think it's a mistake but your screenshots are identical. I will try to reproduce your issue on my side and keep your updated. In the meantime, I released v1.1.0 which is not yet approved by Grafana Cloud but available in Github releases. Can you give it a try and check if your problem persist?
Just updated, the pic to see difference. I will test with 1.1.0 and let you know
I'm closing this due to inactivity, please open a new issue if you still have troubles using our plugin