chart.TimeSeries() ignores 'type'
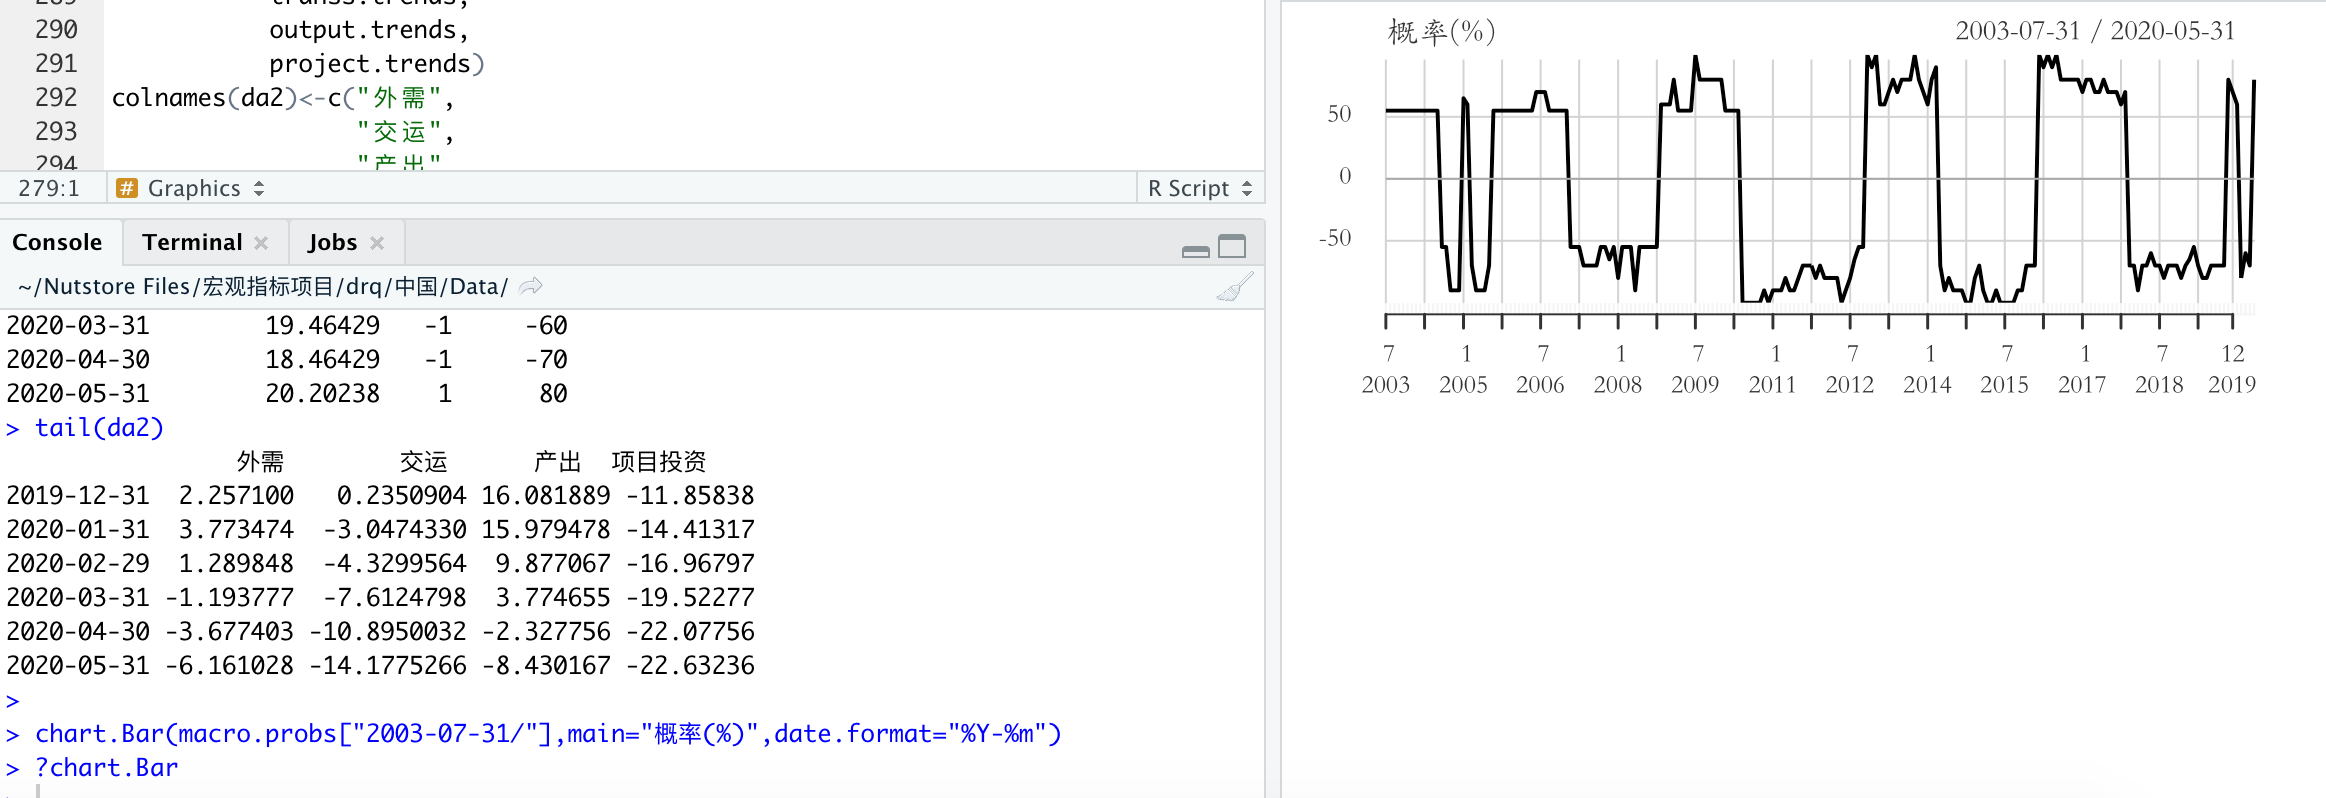
when I use chart.Bar to plot a figure, it plots a "line" type figure.
version of r-base is 4.0.2
version of PerformanceAnalytics is 2.0.4
This is because chart.TimeSeries() does not respect the type argument. So it's not specific to chart.Bar() or the operating system.
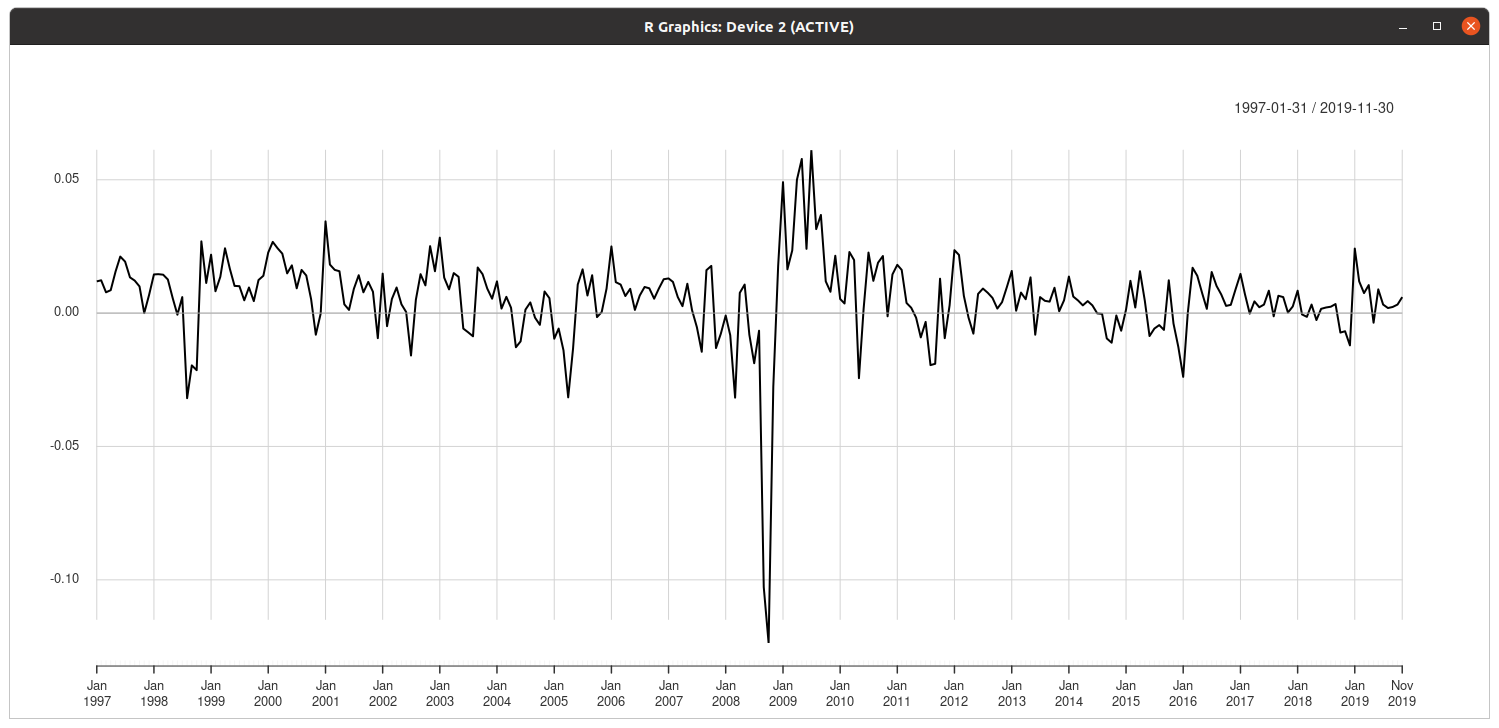
For example, this produces a line graph when it should produce a histogram.
chart.TimeSeries(edhec[,1], type = "h")
This is because
chart.TimeSeries()does not respect thetypeargument. So it's not specific tochart.Bar()or the operating system.For example, this produces a line graph when it should produce a histogram.
chart.TimeSeries(edhec[,1], type = "h")
I had tried chart.TimeSeries(……, type = "h") too, the result was same as yours. But I also tried some other "type" argument except "h", many of them worked. So I think "chart.TimeSeries() ignores 'type'" is not that accuracy. chart.Bar in my windows environment works, but my version of PerformanceAnalytics in windows is 1.5.2, so I don't know this problem related to my operating system or the PerformanceAnalytics version.
But I also tried some other "type" argument except "h", many of them worked.
Which did you try that worked? I tried "h", "p", "b", and "n". All of them were the same as type = "l".
chart.Bar in my windows environment works, but my version of PerformanceAnalytics in windows is 1.5.2, so I don't know this problem related to my operating system or the PerformanceAnalytics version.
It's related to the PerformanceAnalytics version. The plotting was updated to use the newer plot.xts() in version 2.0.4. Version 1.5.2 was released at the beginning of 2018.