bevy
 bevy copied to clipboard
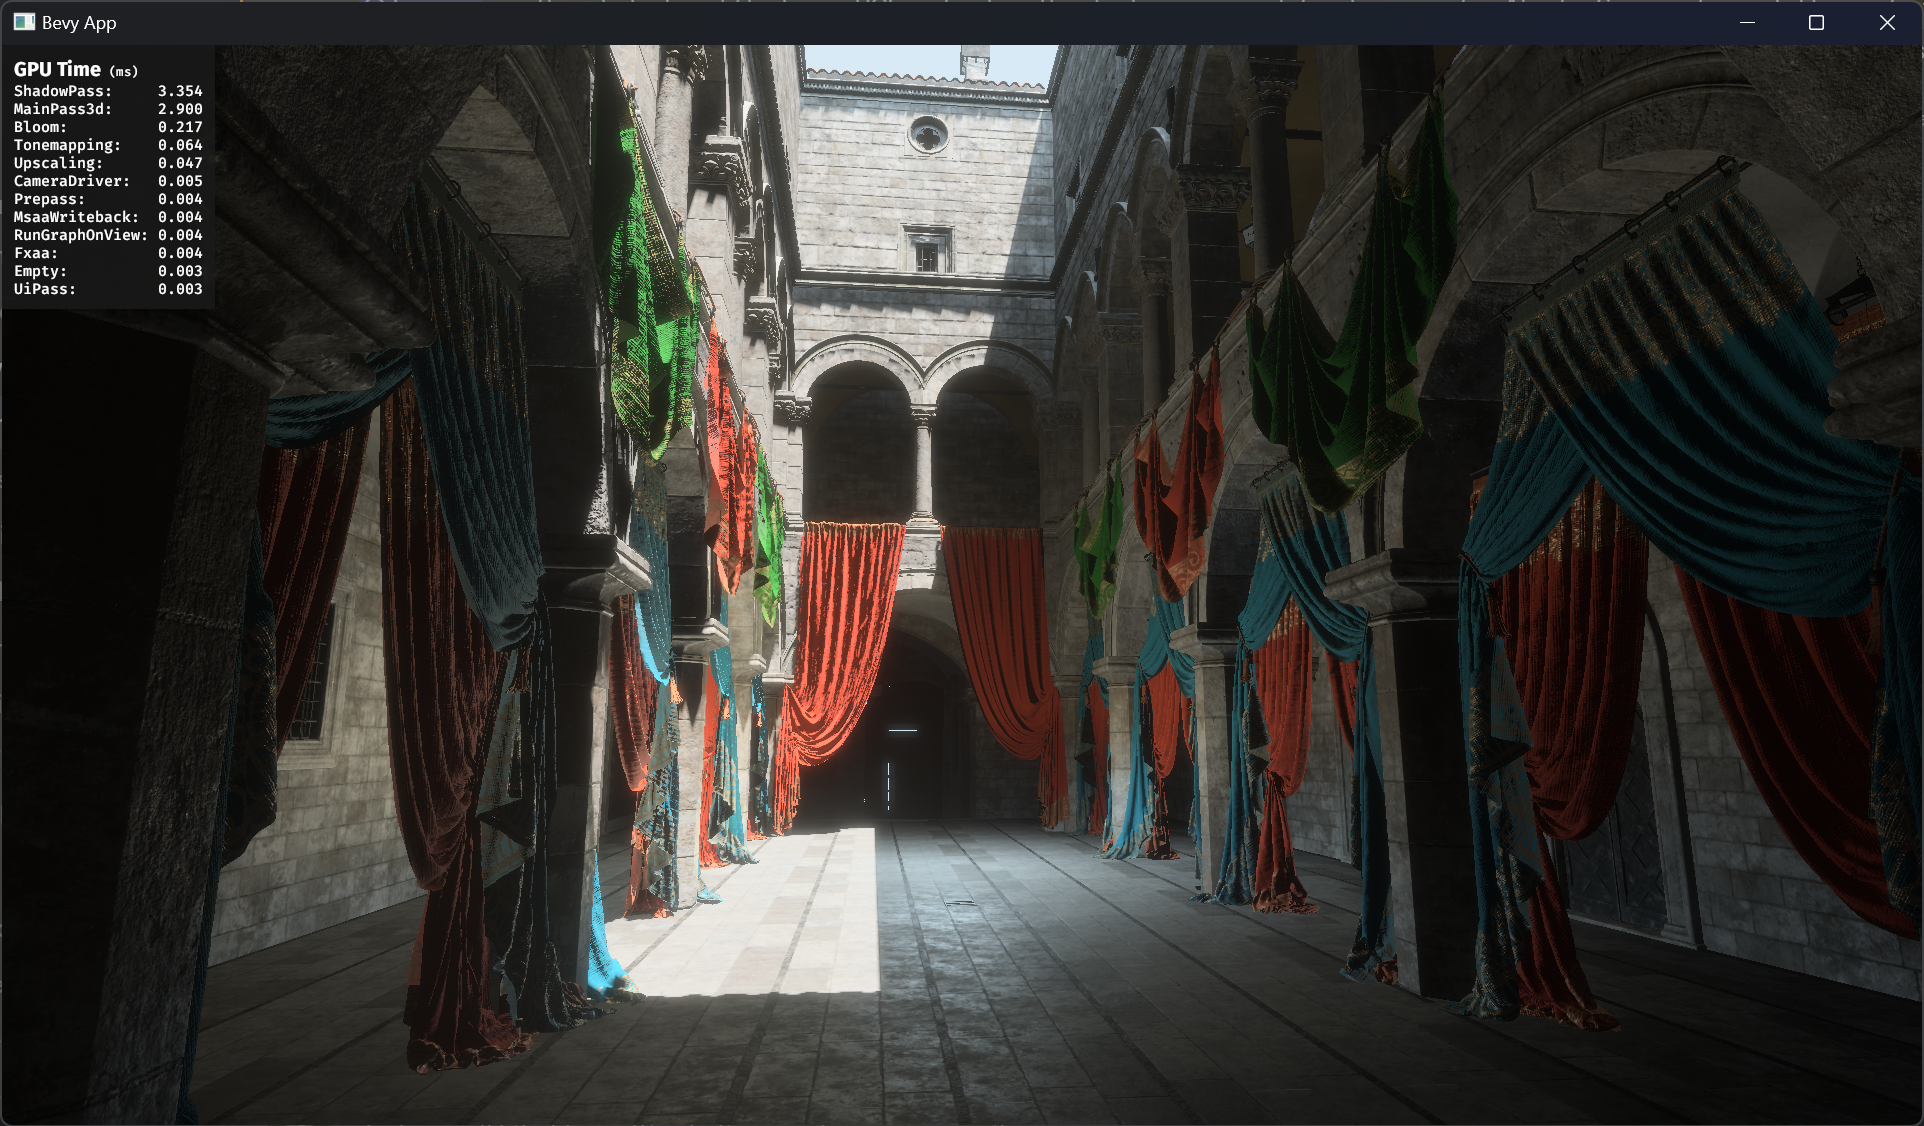
Render node GPU timing overlay
Objective
- When developing rendering features, it's useful to know how expensive they are. Tracy already lets us measure CPU time per-node, but we don't currently have a way of measuring how long the GPU spends on each render node.
Solution
- Use wgpu-profiler to insert timestamp queries around render nodes when WgpuFeatures::TIMESTAMP_QUERY is enabled.
- Query results are put into a resource shared between the main and render world with a mutex.
- Add DebugOverlaysPlugin to display a UI showing the timer query results.
- Every frame, the plugin reads from the query result resource and aggregates it into an exponential running average.
- Every 1s, the plugin updates the UI to show the aggregated results.
TODO
- Support displaying nested spans
- Add some kind of variance indicator for each pass
- Skip nodes that don't actually run (requires render graph changes probably)
- Documentation
Changelog
This section is optional. If this was a trivial fix, or has no externally-visible impact, you can delete this section.
- What changed as a result of this PR?
- If applicable, organize changes under "Added", "Changed", or "Fixed" sub-headings
- Stick to one or two sentences. If more detail is needed for a particular change, consider adding it to the "Solution" section
- If you can't summarize the work, your change may be unreasonably large / unrelated. Consider splitting your PR to make it easier to review and merge!
Migration Guide
This section is optional. If there are no breaking changes, you can delete this section.
- If this PR is a breaking change (relative to the last release of Bevy), describe how a user might need to migrate their code to support these changes
- Simply adding new functionality is not a breaking change.
- Fixing behavior that was definitely a bug, rather than a questionable design choice is not a breaking change.
Why only refresh every second? It seems a bit slow to me.
There's one issue with this, I'm not sure if it's a blocker, but the fact that it uses bevy_ui means that if a game already has a ui it can't reuse this plugin. We would need to be able to draw debug ui on top of everything including other ui nodes.
One thing that would be cool in the future is to have the ability to draw shaders in a bevy_ui node which would make rendering a frametime graph really easy.
Why only refresh every second? It seems a bit slow to me.
If I refresh every frame, the numbers would move too fast to read. We can tweak how fast it refreshes, maybe it should be 0.5s. I could also make it configurable.
There's one issue with this, I'm not sure if it's a blocker, but the fact that it uses bevy_ui means that if a game already has a ui it can't reuse this plugin. We would need to be able to draw debug ui on top of everything including other ui nodes.
Is this a problem? I haven't tested it with anything that has UI already. We can probably solve this with Z-layers or camera orders or something.
One thing that would be cool in the future is to have the ability to draw shaders in a bevy_ui node which would make rendering a frametime graph really easy.
Agreed. I've also seen users request this feature.
Yeah, making the timing configurable does seem like the best option.
Is this a problem?
Not necessarily, but it's possible that people do weird thing with their UIs and that enabling this plugin breaks it. Or just that z-layers won't be enough. Probably not worth blocking on it though. Just something to consider for the future I guess.
Wonder if we could just reserve some z-layers for internal stuff?
I'm also not sure a UI display for this is the most apt approach since this is always compiled in. We may want to instead expose spans or counters to profilers instead.
You could display every frame and then a sliding average as well. Or a sliding max is perhaps more interesting?
I'm also not sure a UI display for this is the most apt approach since this is always compiled in. We may want to instead expose spans or counters to profilers instead.
That's basically what this PR does. It optionally allows recording GPU pass durations (not on by default), and then adds a plugin (not added by default) that lets you display the results.
You could display every frame and then a sliding average as well. Or a sliding max is perhaps more interesting?
Currently it's an exponential moving average, with the UI updated every 300ms (300/16.6 ~= 18 frames @ 60fps). Maybe I should do something like the average of a 20 frame sliding window, with stddev/variance of the window alongside it? Let me know what you think.
Example alien_cake_addict failed to run, please try running it locally and check the result.
Can we defer nested spans to a future PR? If so, I think this PR is done now.
Maybe this should be moved to bevy_diagnostics under an optional feature, if that won't cause cyclic dependencies...
A nice visualization technique I've seen: Each top level profiling group/span is associated with a random(?) color, and all sub-spans are the same color (and indented one).
Visualizations I've seen also tend not to sort by timing, and keep the order stable.
Instead of locking to max clocks, the script should probably lock to GPU base clocks. This is what NSight does.