LDhat
 LDhat copied to clipboard
Composite-likelihood and rho plot
Hello,
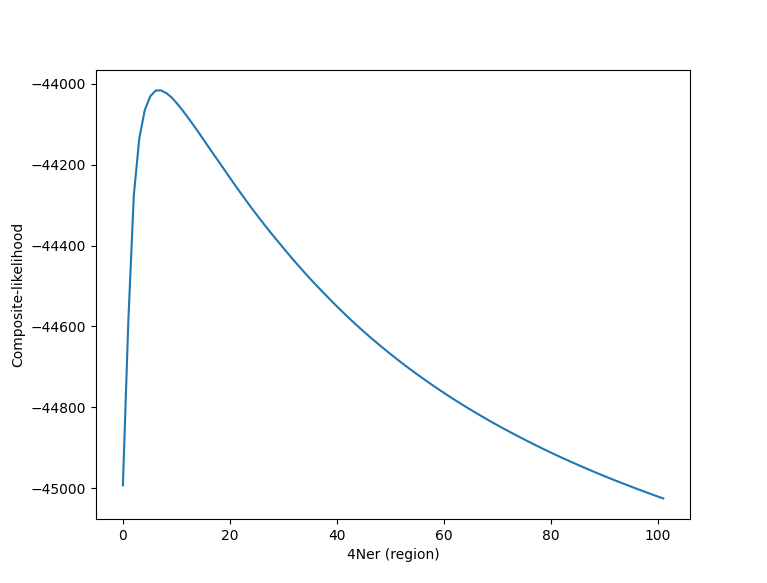
Thank you for your software. I was wondering what does it mean when the composite likelihood plateaus for different values of rho as shown in the figure:

Thank you!
You get such a profile when there is essentially no LD in the region - i.e. the data are consistent with a model in which there is 'infinite' recombination.
Thank you very much for your reply. I worked a bit more with the data and I still get the same result. The data are of 2000 SNPs (genotypes) in a region of about 1 mega base. Does this mean there is an error with the data or could this have some biological meaning? Wouldn't we expect at least some level of LD in a region of about 1 Mb?
Thanks a lot again!
Hi again,
It was indeed a too much large region. I took a smaller region of about 50 SNPs (about 35 Kb) and now I see a peak in my composite likelihood plot.
Thanks again, Homa