Titanic-Machine-Learning-from-Disaster
 Titanic-Machine-Learning-from-Disaster copied to clipboard
Start here if... You're new to data science and machine learning, or looking for a simple intro to the Kaggle prediction competitions. Competition Description The sinking of the RMS Titanic is one of...
Titanic Passanger Survival Analysis
from IPython.display import Image
Image(url= "https://static1.squarespace.com/static/5006453fe4b09ef2252ba068/5095eabce4b06cb305058603/5095eabce4b02d37bef4c24c/1352002236895/100_anniversary_titanic_sinking_by_esai8mellows-d4xbme8.jpg")

import pandas as pd
import numpy as np
train = pd.read_csv("input/train.csv")
test = pd.read_csv("input/test.csv")
train.isnull().sum()
print("Train Shape:",train.shape)
test.isnull().sum()
print("Test Shape:",test.shape)
Train Shape: (891, 12)
Test Shape: (418, 11)
train.info()
<class 'pandas.core.frame.DataFrame'>
RangeIndex: 891 entries, 0 to 890
Data columns (total 12 columns):
PassengerId    891 non-null int64
Survived       891 non-null int64
Pclass         891 non-null int64
Name           891 non-null object
Sex            891 non-null object
Age            714 non-null float64
SibSp          891 non-null int64
Parch          891 non-null int64
Ticket         891 non-null object
Fare           891 non-null float64
Cabin          204 non-null object
Embarked       889 non-null object
dtypes: float64(2), int64(5), object(5)
memory usage: 83.6+ KB
test.info()
<class 'pandas.core.frame.DataFrame'>
RangeIndex: 418 entries, 0 to 417
Data columns (total 11 columns):
PassengerId    418 non-null int64
Pclass         418 non-null int64
Name           418 non-null object
Sex            418 non-null object
Age            332 non-null float64
SibSp          418 non-null int64
Parch          418 non-null int64
Ticket         418 non-null object
Fare           417 non-null float64
Cabin          91 non-null object
Embarked       418 non-null object
dtypes: float64(2), int64(4), object(5)
memory usage: 36.0+ KB
Data Dictionary
- Survived: 0 = No, 1 = Yes
- pclass: Ticket class 1 = 1st, 2 = 2nd, 3 = 3rd
- sibsp: # of siblings / spouses aboard the Titanic
- parch: # of parents / children aboard the Titanic
- ticket: Ticket number
- cabin: Cabin number
- embarked: Port of Embarkation C = Cherbourg, Q = Queenstown, S = Southampton
Total rows and columns
We can see that there are 891 rows and 12 columns in our training dataset.
train.head(10)
| PassengerId | Survived | Pclass | Name | Sex | Age | SibSp | Parch | Ticket | Fare | Cabin | Embarked | |
|---|---|---|---|---|---|---|---|---|---|---|---|---|
| 0 | 1 | 0 | 3 | Braund, Mr. Owen Harris | male | 22.0 | 1 | 0 | A/5 21171 | 7.2500 | NaN | S |
| 1 | 2 | 1 | 1 | Cumings, Mrs. John Bradley (Florence Briggs Th... | female | 38.0 | 1 | 0 | PC 17599 | 71.2833 | C85 | C |
| 2 | 3 | 1 | 3 | Heikkinen, Miss. Laina | female | 26.0 | 0 | 0 | STON/O2. 3101282 | 7.9250 | NaN | S |
| 3 | 4 | 1 | 1 | Futrelle, Mrs. Jacques Heath (Lily May Peel) | female | 35.0 | 1 | 0 | 113803 | 53.1000 | C123 | S |
| 4 | 5 | 0 | 3 | Allen, Mr. William Henry | male | 35.0 | 0 | 0 | 373450 | 8.0500 | NaN | S |
| 5 | 6 | 0 | 3 | Moran, Mr. James | male | NaN | 0 | 0 | 330877 | 8.4583 | NaN | Q |
| 6 | 7 | 0 | 1 | McCarthy, Mr. Timothy J | male | 54.0 | 0 | 0 | 17463 | 51.8625 | E46 | S |
| 7 | 8 | 0 | 3 | Palsson, Master. Gosta Leonard | male | 2.0 | 3 | 1 | 349909 | 21.0750 | NaN | S |
| 8 | 9 | 1 | 3 | Johnson, Mrs. Oscar W (Elisabeth Vilhelmina Berg) | female | 27.0 | 0 | 2 | 347742 | 11.1333 | NaN | S |
| 9 | 10 | 1 | 2 | Nasser, Mrs. Nicholas (Adele Achem) | female | 14.0 | 1 | 0 | 237736 | 30.0708 | NaN | C |
train.describe()
| PassengerId | Survived | Pclass | Age | SibSp | Parch | Fare | |
|---|---|---|---|---|---|---|---|
| count | 891.000000 | 891.000000 | 891.000000 | 714.000000 | 891.000000 | 891.000000 | 891.000000 |
| mean | 446.000000 | 0.383838 | 2.308642 | 29.699118 | 0.523008 | 0.381594 | 32.204208 |
| std | 257.353842 | 0.486592 | 0.836071 | 14.526497 | 1.102743 | 0.806057 | 49.693429 |
| min | 1.000000 | 0.000000 | 1.000000 | 0.420000 | 0.000000 | 0.000000 | 0.000000 |
| 25% | 223.500000 | 0.000000 | 2.000000 | 20.125000 | 0.000000 | 0.000000 | 7.910400 |
| 50% | 446.000000 | 0.000000 | 3.000000 | 28.000000 | 0.000000 | 0.000000 | 14.454200 |
| 75% | 668.500000 | 1.000000 | 3.000000 | 38.000000 | 1.000000 | 0.000000 | 31.000000 |
| max | 891.000000 | 1.000000 | 3.000000 | 80.000000 | 8.000000 | 6.000000 | 512.329200 |
test.describe()
| PassengerId | Pclass | Age | SibSp | Parch | Fare | |
|---|---|---|---|---|---|---|
| count | 418.000000 | 418.000000 | 332.000000 | 418.000000 | 418.000000 | 417.000000 |
| mean | 1100.500000 | 2.265550 | 30.272590 | 0.447368 | 0.392344 | 35.627188 |
| std | 120.810458 | 0.841838 | 14.181209 | 0.896760 | 0.981429 | 55.907576 |
| min | 892.000000 | 1.000000 | 0.170000 | 0.000000 | 0.000000 | 0.000000 |
| 25% | 996.250000 | 1.000000 | 21.000000 | 0.000000 | 0.000000 | 7.895800 |
| 50% | 1100.500000 | 3.000000 | 27.000000 | 0.000000 | 0.000000 | 14.454200 |
| 75% | 1204.750000 | 3.000000 | 39.000000 | 1.000000 | 0.000000 | 31.500000 |
| max | 1309.000000 | 3.000000 | 76.000000 | 8.000000 | 9.000000 | 512.329200 |
train.isnull().sum()
PassengerId      0
Survived         0
Pclass           0
Name             0
Sex              0
Age            177
SibSp            0
Parch            0
Ticket           0
Fare             0
Cabin          687
Embarked         2
dtype: int64
test.isnull().sum()
test["Survived"] = ""
test.head()
| PassengerId | Pclass | Name | Sex | Age | SibSp | Parch | Ticket | Fare | Cabin | Embarked | Survived | |
|---|---|---|---|---|---|---|---|---|---|---|---|---|
| 0 | 892 | 3 | Kelly, Mr. James | male | 34.5 | 0 | 0 | 330911 | 7.8292 | NaN | Q | |
| 1 | 893 | 3 | Wilkes, Mrs. James (Ellen Needs) | female | 47.0 | 1 | 0 | 363272 | 7.0000 | NaN | S | |
| 2 | 894 | 2 | Myles, Mr. Thomas Francis | male | 62.0 | 0 | 0 | 240276 | 9.6875 | NaN | Q | |
| 3 | 895 | 3 | Wirz, Mr. Albert | male | 27.0 | 0 | 0 | 315154 | 8.6625 | NaN | S | |
| 4 | 896 | 3 | Hirvonen, Mrs. Alexander (Helga E Lindqvist) | female | 22.0 | 1 | 1 | 3101298 | 12.2875 | NaN | S |
Data Visualization using Matplotlib and Seaborn packages.
import matplotlib.pyplot as plt # Plot the graphes
%matplotlib inline
import seaborn as sns
sns.set() # setting seaborn default for plots
Bar Chart for Categorical Features
- Pclass
- Sex
- SibSp ( # of siblings and spouse)
- Parch ( # of parents and children)
- Embarked
- Cabin
def bar_chart(feature):
    survived = train[train['Survived']==1][feature].value_counts()
    dead = train[train['Survived']==0][feature].value_counts()
    df = pd.DataFrame([survived,dead])
    df.index = ['Survived','Dead']
    df.plot(kind='bar',stacked=True, figsize=(10,5))
bar_chart('Sex')
print("Survived :\n",train[train['Survived']==1]['Sex'].value_counts())
print("Dead:\n",train[train['Survived']==0]['Sex'].value_counts())
Survived :
 female    233
male      109
Name: Sex, dtype: int64
Dead:
 male      468
female     81
Name: Sex, dtype: int64

The Chart confirms Women more likely survivied than Men.
bar_chart('Pclass')
print("Survived :\n",train[train['Survived']==1]['Pclass'].value_counts())
print("Dead:\n",train[train['Survived']==0]['Pclass'].value_counts())
Survived :
 1    136
3    119
2     87
Name: Pclass, dtype: int64
Dead:
 3    372
2     97
1     80
Name: Pclass, dtype: int64

The Chart confirms 1st class more likely survivied than other classes.
The Chart confirms 3rd class more likely dead than other classes
bar_chart('SibSp')
print("Survived :\n",train[train['Survived']==1]['SibSp'].value_counts())
print("Dead:\n",train[train['Survived']==0]['SibSp'].value_counts())
Survived :
 0    210
1    112
2     13
3      4
4      3
Name: SibSp, dtype: int64
Dead:
 0    398
1     97
4     15
2     15
3     12
8      7
5      5
Name: SibSp, dtype: int64

The Chart confirms a person aboarded with more than 2 siblings or spouse more likely survived.
The Chart confirms a person aboarded without siblings or spouse more likely dead
bar_chart('Parch')
print("Survived :\n",train[train['Survived']==1]['Parch'].value_counts())
print("Dead:\n",train[train['Survived']==0]['Parch'].value_counts())
Survived :
 0    233
1     65
2     40
3      3
5      1
Name: Parch, dtype: int64
Dead:
 0    445
1     53
2     40
5      4
4      4
3      2
6      1
Name: Parch, dtype: int64

The Chart confirms a person aboarded with more than 2 parents or children more likely survived.
The Chart confirms a person aboarded alone more likely dead
bar_chart('Embarked')
print("Survived :\n",train[train['Survived']==1]['Embarked'].value_counts())
print("Dead:\n",train[train['Survived']==0]['Embarked'].value_counts())
Survived :
 S    217
C     93
Q     30
Name: Embarked, dtype: int64
Dead:
 S    427
C     75
Q     47
Name: Embarked, dtype: int64

The Chart confirms a person aboarded from C slightly more likely survived.
The Chart confirms a person aboarded from Q more likely dead.
The Chart confirms a person aboarded from S more likely dead.
4. Feature engineering
Feature engineering is the process of using domain knowledge of the data to create features (feature vectors) that make machine learning algorithms work.
feature vector is an n-dimensional vector of numerical features that represent some object. Many algorithms in machine learning require a numerical representation of objects, since such representations facilitate processing and statistical analysis.
train.head()
| PassengerId | Survived | Pclass | Name | Sex | Age | SibSp | Parch | Ticket | Fare | Cabin | Embarked | |
|---|---|---|---|---|---|---|---|---|---|---|---|---|
| 0 | 1 | 0 | 3 | Braund, Mr. Owen Harris | male | 22.0 | 1 | 0 | A/5 21171 | 7.2500 | NaN | S |
| 1 | 2 | 1 | 1 | Cumings, Mrs. John Bradley (Florence Briggs Th... | female | 38.0 | 1 | 0 | PC 17599 | 71.2833 | C85 | C |
| 2 | 3 | 1 | 3 | Heikkinen, Miss. Laina | female | 26.0 | 0 | 0 | STON/O2. 3101282 | 7.9250 | NaN | S |
| 3 | 4 | 1 | 1 | Futrelle, Mrs. Jacques Heath (Lily May Peel) | female | 35.0 | 1 | 0 | 113803 | 53.1000 | C123 | S |
| 4 | 5 | 0 | 3 | Allen, Mr. William Henry | male | 35.0 | 0 | 0 | 373450 | 8.0500 | NaN | S |
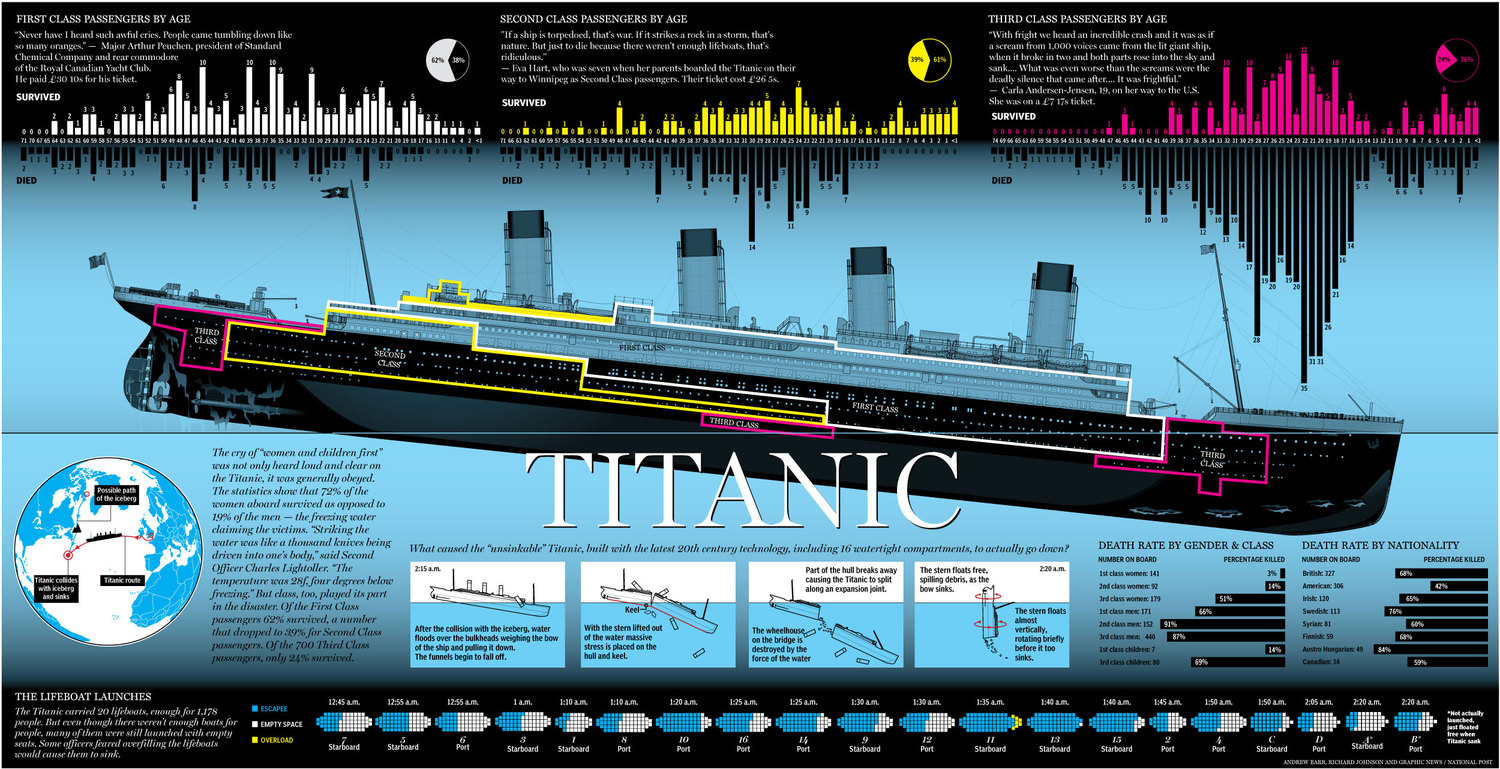
4.1 how titanic sank?
Image(url= "https://static1.squarespace.com/static/5006453fe4b09ef2252ba068/t/5090b249e4b047ba54dfd258/1351660113175/TItanic-Survival-Infographic.jpg?format=1500w")
train.head(10)
| PassengerId | Survived | Pclass | Name | Sex | Age | SibSp | Parch | Ticket | Fare | Cabin | Embarked | |
|---|---|---|---|---|---|---|---|---|---|---|---|---|
| 0 | 1 | 0 | 3 | Braund, Mr. Owen Harris | male | 22.0 | 1 | 0 | A/5 21171 | 7.2500 | NaN | S |
| 1 | 2 | 1 | 1 | Cumings, Mrs. John Bradley (Florence Briggs Th... | female | 38.0 | 1 | 0 | PC 17599 | 71.2833 | C85 | C |
| 2 | 3 | 1 | 3 | Heikkinen, Miss. Laina | female | 26.0 | 0 | 0 | STON/O2. 3101282 | 7.9250 | NaN | S |
| 3 | 4 | 1 | 1 | Futrelle, Mrs. Jacques Heath (Lily May Peel) | female | 35.0 | 1 | 0 | 113803 | 53.1000 | C123 | S |
| 4 | 5 | 0 | 3 | Allen, Mr. William Henry | male | 35.0 | 0 | 0 | 373450 | 8.0500 | NaN | S |
| 5 | 6 | 0 | 3 | Moran, Mr. James | male | NaN | 0 | 0 | 330877 | 8.4583 | NaN | Q |
| 6 | 7 | 0 | 1 | McCarthy, Mr. Timothy J | male | 54.0 | 0 | 0 | 17463 | 51.8625 | E46 | S |
| 7 | 8 | 0 | 3 | Palsson, Master. Gosta Leonard | male | 2.0 | 3 | 1 | 349909 | 21.0750 | NaN | S |
| 8 | 9 | 1 | 3 | Johnson, Mrs. Oscar W (Elisabeth Vilhelmina Berg) | female | 27.0 | 0 | 2 | 347742 | 11.1333 | NaN | S |
| 9 | 10 | 1 | 2 | Nasser, Mrs. Nicholas (Adele Achem) | female | 14.0 | 1 | 0 | 237736 | 30.0708 | NaN | C |
train_test_data = [train,test] # combine dataset

for dataset in train_test_data:
    dataset['Title'] = dataset['Name'].str.extract(' ([A-Za-z]+)\.', expand=False)
train['Title'].value_counts()
Mr          517
Miss        182
Mrs         125
Master       40
Dr            7
Rev           6
Mlle          2
Col           2
Major         2
Lady          1
Sir           1
Mme           1
Ms            1
Don           1
Countess      1
Capt          1
Jonkheer      1
Name: Title, dtype: int64
test['Title'].value_counts()
Mr        240
Miss       78
Mrs        72
Master     21
Rev         2
Col         2
Dr          1
Ms          1
Dona        1
Name: Title, dtype: int64
Title Map
Mr : 0
Miss : 1
Mrs: 2
Others: 3
title_mapping = {"Mr": 0, "Miss": 1, "Mrs": 2,
                 "Master": 3, "Dr": 3, "Rev": 3, "Col": 3, "Major": 3, "Mlle": 3,"Countess": 3,
                 "Ms": 3, "Lady": 3, "Jonkheer": 3, "Don": 3, "Dona" : 3, "Mme": 3,"Capt": 3,"Sir": 3 }

for dataset in train_test_data:
    dataset['Title'] = dataset["Title"].map(title_mapping)
dataset.head()
| PassengerId | Pclass | Name | Sex | Age | SibSp | Parch | Ticket | Fare | Cabin | Embarked | Survived | Title | |
|---|---|---|---|---|---|---|---|---|---|---|---|---|---|
| 0 | 892 | 3 | Kelly, Mr. James | male | 34.5 | 0 | 0 | 330911 | 7.8292 | NaN | Q | 0 | |
| 1 | 893 | 3 | Wilkes, Mrs. James (Ellen Needs) | female | 47.0 | 1 | 0 | 363272 | 7.0000 | NaN | S | 2 | |
| 2 | 894 | 2 | Myles, Mr. Thomas Francis | male | 62.0 | 0 | 0 | 240276 | 9.6875 | NaN | Q | 0 | |
| 3 | 895 | 3 | Wirz, Mr. Albert | male | 27.0 | 0 | 0 | 315154 | 8.6625 | NaN | S | 0 | |
| 4 | 896 | 3 | Hirvonen, Mrs. Alexander (Helga E Lindqvist) | female | 22.0 | 1 | 1 | 3101298 | 12.2875 | NaN | S | 2 |
test.head()
| PassengerId | Pclass | Name | Sex | Age | SibSp | Parch | Ticket | Fare | Cabin | Embarked | Survived | Title | |
|---|---|---|---|---|---|---|---|---|---|---|---|---|---|
| 0 | 892 | 3 | Kelly, Mr. James | male | 34.5 | 0 | 0 | 330911 | 7.8292 | NaN | Q | 0 | |
| 1 | 893 | 3 | Wilkes, Mrs. James (Ellen Needs) | female | 47.0 | 1 | 0 | 363272 | 7.0000 | NaN | S | 2 | |
| 2 | 894 | 2 | Myles, Mr. Thomas Francis | male | 62.0 | 0 | 0 | 240276 | 9.6875 | NaN | Q | 0 | |
| 3 | 895 | 3 | Wirz, Mr. Albert | male | 27.0 | 0 | 0 | 315154 | 8.6625 | NaN | S | 0 | |
| 4 | 896 | 3 | Hirvonen, Mrs. Alexander (Helga E Lindqvist) | female | 22.0 | 1 | 1 | 3101298 | 12.2875 | NaN | S | 2 |
bar_chart('Title')

# delete unnecessary feature from dataset
train.drop('Name', axis=1, inplace=True)
test.drop('Name', axis=1, inplace=True)
train.head()
| PassengerId | Survived | Pclass | Sex | Age | SibSp | Parch | Ticket | Fare | Cabin | Embarked | Title | |
|---|---|---|---|---|---|---|---|---|---|---|---|---|
| 0 | 1 | 0 | 3 | male | 22.0 | 1 | 0 | A/5 21171 | 7.2500 | NaN | S | 0 |
| 1 | 2 | 1 | 1 | female | 38.0 | 1 | 0 | PC 17599 | 71.2833 | C85 | C | 2 |
| 2 | 3 | 1 | 3 | female | 26.0 | 0 | 0 | STON/O2. 3101282 | 7.9250 | NaN | S | 1 |
| 3 | 4 | 1 | 1 | female | 35.0 | 1 | 0 | 113803 | 53.1000 | C123 | S | 2 |
| 4 | 5 | 0 | 3 | male | 35.0 | 0 | 0 | 373450 | 8.0500 | NaN | S | 0 |
sex_mapping = {"male": 0, "female": 1}
for dataset in train_test_data:
    dataset['Sex'] = dataset['Sex'].map(sex_mapping)
bar_chart('Sex')

test.head()
| PassengerId | Pclass | Sex | Age | SibSp | Parch | Ticket | Fare | Cabin | Embarked | Survived | Title | |
|---|---|---|---|---|---|---|---|---|---|---|---|---|
| 0 | 892 | 3 | 0 | 34.5 | 0 | 0 | 330911 | 7.8292 | NaN | Q | 0 | |
| 1 | 893 | 3 | 1 | 47.0 | 1 | 0 | 363272 | 7.0000 | NaN | S | 2 | |
| 2 | 894 | 2 | 0 | 62.0 | 0 | 0 | 240276 | 9.6875 | NaN | Q | 0 | |
| 3 | 895 | 3 | 0 | 27.0 | 0 | 0 | 315154 | 8.6625 | NaN | S | 0 | |
| 4 | 896 | 3 | 1 | 22.0 | 1 | 1 | 3101298 | 12.2875 | NaN | S | 2 |
train["Age"].fillna(train.groupby("Title")["Age"].transform("median"), inplace= True)
test["Age"].fillna(test.groupby('Title')['Age'].transform("median"), inplace= True)
train.head(30)
#train.groupby("Title")["Age"].transform("median")
| PassengerId | Survived | Pclass | Sex | Age | SibSp | Parch | Ticket | Fare | Cabin | Embarked | Title | |
|---|---|---|---|---|---|---|---|---|---|---|---|---|
| 0 | 1 | 0 | 3 | 0 | 22.0 | 1 | 0 | A/5 21171 | 7.2500 | NaN | S | 0 |
| 1 | 2 | 1 | 1 | 1 | 38.0 | 1 | 0 | PC 17599 | 71.2833 | C85 | C | 2 |
| 2 | 3 | 1 | 3 | 1 | 26.0 | 0 | 0 | STON/O2. 3101282 | 7.9250 | NaN | S | 1 |
| 3 | 4 | 1 | 1 | 1 | 35.0 | 1 | 0 | 113803 | 53.1000 | C123 | S | 2 |
| 4 | 5 | 0 | 3 | 0 | 35.0 | 0 | 0 | 373450 | 8.0500 | NaN | S | 0 |
| 5 | 6 | 0 | 3 | 0 | 30.0 | 0 | 0 | 330877 | 8.4583 | NaN | Q | 0 |
| 6 | 7 | 0 | 1 | 0 | 54.0 | 0 | 0 | 17463 | 51.8625 | E46 | S | 0 |
| 7 | 8 | 0 | 3 | 0 | 2.0 | 3 | 1 | 349909 | 21.0750 | NaN | S | 3 |
| 8 | 9 | 1 | 3 | 1 | 27.0 | 0 | 2 | 347742 | 11.1333 | NaN | S | 2 |
| 9 | 10 | 1 | 2 | 1 | 14.0 | 1 | 0 | 237736 | 30.0708 | NaN | C | 2 |
| 10 | 11 | 1 | 3 | 1 | 4.0 | 1 | 1 | PP 9549 | 16.7000 | G6 | S | 1 |
| 11 | 12 | 1 | 1 | 1 | 58.0 | 0 | 0 | 113783 | 26.5500 | C103 | S | 1 |
| 12 | 13 | 0 | 3 | 0 | 20.0 | 0 | 0 | A/5. 2151 | 8.0500 | NaN | S | 0 |
| 13 | 14 | 0 | 3 | 0 | 39.0 | 1 | 5 | 347082 | 31.2750 | NaN | S | 0 |
| 14 | 15 | 0 | 3 | 1 | 14.0 | 0 | 0 | 350406 | 7.8542 | NaN | S | 1 |
| 15 | 16 | 1 | 2 | 1 | 55.0 | 0 | 0 | 248706 | 16.0000 | NaN | S | 2 |
| 16 | 17 | 0 | 3 | 0 | 2.0 | 4 | 1 | 382652 | 29.1250 | NaN | Q | 3 |
| 17 | 18 | 1 | 2 | 0 | 30.0 | 0 | 0 | 244373 | 13.0000 | NaN | S | 0 |
| 18 | 19 | 0 | 3 | 1 | 31.0 | 1 | 0 | 345763 | 18.0000 | NaN | S | 2 |
| 19 | 20 | 1 | 3 | 1 | 35.0 | 0 | 0 | 2649 | 7.2250 | NaN | C | 2 |
| 20 | 21 | 0 | 2 | 0 | 35.0 | 0 | 0 | 239865 | 26.0000 | NaN | S | 0 |
| 21 | 22 | 1 | 2 | 0 | 34.0 | 0 | 0 | 248698 | 13.0000 | D56 | S | 0 |
| 22 | 23 | 1 | 3 | 1 | 15.0 | 0 | 0 | 330923 | 8.0292 | NaN | Q | 1 |
| 23 | 24 | 1 | 1 | 0 | 28.0 | 0 | 0 | 113788 | 35.5000 | A6 | S | 0 |
| 24 | 25 | 0 | 3 | 1 | 8.0 | 3 | 1 | 349909 | 21.0750 | NaN | S | 1 |
| 25 | 26 | 1 | 3 | 1 | 38.0 | 1 | 5 | 347077 | 31.3875 | NaN | S | 2 |
| 26 | 27 | 0 | 3 | 0 | 30.0 | 0 | 0 | 2631 | 7.2250 | NaN | C | 0 |
| 27 | 28 | 0 | 1 | 0 | 19.0 | 3 | 2 | 19950 | 263.0000 | C23 C25 C27 | S | 0 |
| 28 | 29 | 1 | 3 | 1 | 21.0 | 0 | 0 | 330959 | 7.8792 | NaN | Q | 1 |
| 29 | 30 | 0 | 3 | 0 | 30.0 | 0 | 0 | 349216 | 7.8958 | NaN | S | 0 |
facet = sns.FacetGrid(train, hue="Survived",aspect=4)
facet.map(sns.kdeplot,'Age',shade= True)
facet.set(xlim=(0, train['Age'].max()))
facet.add_legend()
plt.show()

facet = sns.FacetGrid(train, hue="Survived",aspect=4)
facet.map(sns.kdeplot,'Age',shade= True)
facet.set(xlim=(0, train['Age'].max()))
facet.add_legend()
plt.xlim(10,50)

(10, 50)

Those who were 20 to 30 years old were more dead and more survived.
train.info()
test.info()
<class 'pandas.core.frame.DataFrame'>
RangeIndex: 891 entries, 0 to 890
Data columns (total 12 columns):
PassengerId    891 non-null int64
Survived       891 non-null int64
Pclass         891 non-null int64
Sex            891 non-null int64
Age            891 non-null float64
SibSp          891 non-null int64
Parch          891 non-null int64
Ticket         891 non-null object
Fare           891 non-null float64
Cabin          204 non-null object
Embarked       889 non-null object
Title          891 non-null int64
dtypes: float64(2), int64(7), object(3)
memory usage: 83.6+ KB
<class 'pandas.core.frame.DataFrame'>
RangeIndex: 418 entries, 0 to 417
Data columns (total 12 columns):
PassengerId    418 non-null int64
Pclass         418 non-null int64
Sex            418 non-null int64
Age            418 non-null float64
SibSp          418 non-null int64
Parch          418 non-null int64
Ticket         418 non-null object
Fare           417 non-null float64
Cabin          91 non-null object
Embarked       418 non-null object
Survived       418 non-null object
Title          418 non-null int64
dtypes: float64(2), int64(6), object(4)
memory usage: 39.3+ KB
Binning
Binning/Converting Numerical Age to Categorical Variable
feature vector map:
- child: 0
- young: 1
- adult: 2
- mid-age: 3
- senior: 4
train.head()
| PassengerId | Survived | Pclass | Sex | Age | SibSp | Parch | Ticket | Fare | Cabin | Embarked | Title | |
|---|---|---|---|---|---|---|---|---|---|---|---|---|
| 0 | 1 | 0 | 3 | 0 | 22.0 | 1 | 0 | A/5 21171 | 7.2500 | NaN | S | 0 |
| 1 | 2 | 1 | 1 | 1 | 38.0 | 1 | 0 | PC 17599 | 71.2833 | C85 | C | 2 |
| 2 | 3 | 1 | 3 | 1 | 26.0 | 0 | 0 | STON/O2. 3101282 | 7.9250 | NaN | S | 1 |
| 3 | 4 | 1 | 1 | 1 | 35.0 | 1 | 0 | 113803 | 53.1000 | C123 | S | 2 |
| 4 | 5 | 0 | 3 | 0 | 35.0 | 0 | 0 | 373450 | 8.0500 | NaN | S | 0 |
for dataset in train_test_data:
    dataset.loc[ dataset['Age'] <= 16, 'Age'] = 0,
    dataset.loc[(dataset['Age'] > 16) & (dataset['Age'] <= 26), 'Age'] = 1,
    dataset.loc[(dataset['Age'] > 26) & (dataset['Age'] <= 36), 'Age'] = 2,
    dataset.loc[(dataset['Age'] > 36) & (dataset['Age'] <= 62), 'Age'] = 3,
    dataset.loc[ dataset['Age'] > 62, 'Age'] = 4
# for dataset in train_test_data:
#     dataset.loc[]
#train[train['Age'].isin([23])]
train.head()
bar_chart('Age')

Pclass1 = train[train['Pclass'] == 1]['Embarked'].value_counts()
Pclass2 = train[train['Pclass'] == 2]['Embarked'].value_counts()
Pclass3 = train[train['Pclass'] == 3]['Embarked'].value_counts()
df = pd.DataFrame([Pclass1,Pclass2,Pclass3])
df.index = ['1st Class','2nd Class','3rd Class']
df.plot(kind = 'bar', stacked =  True, figsize=(10,5))
plt.show()
print("Pclass1:\n",Pclass1)
print("Pclass2:\n",Pclass2)
print("Pclass3:\n",Pclass3)

Pclass1:
 S    127
C     85
Q      2
Name: Embarked, dtype: int64
Pclass2:
 S    164
C     17
Q      3
Name: Embarked, dtype: int64
Pclass3:
 S    353
Q     72
C     66
Name: Embarked, dtype: int64
more than 50 % of 1st class are from S embark.
more than 50 % of 2st class are from S embark.
more than 50 % of 3st class are from S embark.
fill out missing embark with S embark
for dataset in train_test_data:
    dataset['Embarked'] =  dataset['Embarked'].fillna('S')
train.head()
| PassengerId | Survived | Pclass | Sex | Age | SibSp | Parch | Ticket | Fare | Cabin | Embarked | Title | |
|---|---|---|---|---|---|---|---|---|---|---|---|---|
| 0 | 1 | 0 | 3 | 0 | 1.0 | 1 | 0 | A/5 21171 | 7.2500 | NaN | S | 0 |
| 1 | 2 | 1 | 1 | 1 | 3.0 | 1 | 0 | PC 17599 | 71.2833 | C85 | C | 2 |
| 2 | 3 | 1 | 3 | 1 | 1.0 | 0 | 0 | STON/O2. 3101282 | 7.9250 | NaN | S | 1 |
| 3 | 4 | 1 | 1 | 1 | 2.0 | 1 | 0 | 113803 | 53.1000 | C123 | S | 2 |
| 4 | 5 | 0 | 3 | 0 | 2.0 | 0 | 0 | 373450 | 8.0500 | NaN | S | 0 |
embarked_mapping = {'S':0,'C':1,'Q':2}
for dataset in train_test_data:
    dataset['Embarked'] = dataset['Embarked'].map(embarked_mapping)
# train["Fare"].fillna(train.groupby("Pclass")["Fare"])
# train["Fare"].fillna(train.groupby("Pclass")["Fare"].transform("median"), inplace = True)
# test["Fare"].fillna(test.groupby("Pclass")["Fare"].transform("median"), inplace = True)
# train.head(50)


# fill missing Fare with median fare for each Pclass
train["Fare"].fillna(train.groupby("Pclass")["Fare"].transform("median"), inplace=True)
test["Fare"].fillna(test.groupby("Pclass")["Fare"].transform("median"), inplace=True)
train.head(50)
| PassengerId | Survived | Pclass | Sex | Age | SibSp | Parch | Ticket | Fare | Cabin | Embarked | Title | |
|---|---|---|---|---|---|---|---|---|---|---|---|---|
| 0 | 1 | 0 | 3 | 0 | 1.0 | 1 | 0 | A/5 21171 | 7.2500 | NaN | 0 | 0 |
| 1 | 2 | 1 | 1 | 1 | 3.0 | 1 | 0 | PC 17599 | 71.2833 | C85 | 1 | 2 |
| 2 | 3 | 1 | 3 | 1 | 1.0 | 0 | 0 | STON/O2. 3101282 | 7.9250 | NaN | 0 | 1 |
| 3 | 4 | 1 | 1 | 1 | 2.0 | 1 | 0 | 113803 | 53.1000 | C123 | 0 | 2 |
| 4 | 5 | 0 | 3 | 0 | 2.0 | 0 | 0 | 373450 | 8.0500 | NaN | 0 | 0 |
| 5 | 6 | 0 | 3 | 0 | 2.0 | 0 | 0 | 330877 | 8.4583 | NaN | 2 | 0 |
| 6 | 7 | 0 | 1 | 0 | 3.0 | 0 | 0 | 17463 | 51.8625 | E46 | 0 | 0 |
| 7 | 8 | 0 | 3 | 0 | 0.0 | 3 | 1 | 349909 | 21.0750 | NaN | 0 | 3 |
| 8 | 9 | 1 | 3 | 1 | 2.0 | 0 | 2 | 347742 | 11.1333 | NaN | 0 | 2 |
| 9 | 10 | 1 | 2 | 1 | 0.0 | 1 | 0 | 237736 | 30.0708 | NaN | 1 | 2 |
| 10 | 11 | 1 | 3 | 1 | 0.0 | 1 | 1 | PP 9549 | 16.7000 | G6 | 0 | 1 |
| 11 | 12 | 1 | 1 | 1 | 3.0 | 0 | 0 | 113783 | 26.5500 | C103 | 0 | 1 |
| 12 | 13 | 0 | 3 | 0 | 1.0 | 0 | 0 | A/5. 2151 | 8.0500 | NaN | 0 | 0 |
| 13 | 14 | 0 | 3 | 0 | 3.0 | 1 | 5 | 347082 | 31.2750 | NaN | 0 | 0 |
| 14 | 15 | 0 | 3 | 1 | 0.0 | 0 | 0 | 350406 | 7.8542 | NaN | 0 | 1 |
| 15 | 16 | 1 | 2 | 1 | 3.0 | 0 | 0 | 248706 | 16.0000 | NaN | 0 | 2 |
| 16 | 17 | 0 | 3 | 0 | 0.0 | 4 | 1 | 382652 | 29.1250 | NaN | 2 | 3 |
| 17 | 18 | 1 | 2 | 0 | 2.0 | 0 | 0 | 244373 | 13.0000 | NaN | 0 | 0 |
| 18 | 19 | 0 | 3 | 1 | 2.0 | 1 | 0 | 345763 | 18.0000 | NaN | 0 | 2 |
| 19 | 20 | 1 | 3 | 1 | 2.0 | 0 | 0 | 2649 | 7.2250 | NaN | 1 | 2 |
| 20 | 21 | 0 | 2 | 0 | 2.0 | 0 | 0 | 239865 | 26.0000 | NaN | 0 | 0 |
| 21 | 22 | 1 | 2 | 0 | 2.0 | 0 | 0 | 248698 | 13.0000 | D56 | 0 | 0 |
| 22 | 23 | 1 | 3 | 1 | 0.0 | 0 | 0 | 330923 | 8.0292 | NaN | 2 | 1 |
| 23 | 24 | 1 | 1 | 0 | 2.0 | 0 | 0 | 113788 | 35.5000 | A6 | 0 | 0 |
| 24 | 25 | 0 | 3 | 1 | 0.0 | 3 | 1 | 349909 | 21.0750 | NaN | 0 | 1 |
| 25 | 26 | 1 | 3 | 1 | 3.0 | 1 | 5 | 347077 | 31.3875 | NaN | 0 | 2 |
| 26 | 27 | 0 | 3 | 0 | 2.0 | 0 | 0 | 2631 | 7.2250 | NaN | 1 | 0 |
| 27 | 28 | 0 | 1 | 0 | 1.0 | 3 | 2 | 19950 | 263.0000 | C23 C25 C27 | 0 | 0 |
| 28 | 29 | 1 | 3 | 1 | 1.0 | 0 | 0 | 330959 | 7.8792 | NaN | 2 | 1 |
| 29 | 30 | 0 | 3 | 0 | 2.0 | 0 | 0 | 349216 | 7.8958 | NaN | 0 | 0 |
| 30 | 31 | 0 | 1 | 0 | 3.0 | 0 | 0 | PC 17601 | 27.7208 | NaN | 1 | 3 |
| 31 | 32 | 1 | 1 | 1 | 2.0 | 1 | 0 | PC 17569 | 146.5208 | B78 | 1 | 2 |
| 32 | 33 | 1 | 3 | 1 | 1.0 | 0 | 0 | 335677 | 7.7500 | NaN | 2 | 1 |
| 33 | 34 | 0 | 2 | 0 | 4.0 | 0 | 0 | C.A. 24579 | 10.5000 | NaN | 0 | 0 |
| 34 | 35 | 0 | 1 | 0 | 2.0 | 1 | 0 | PC 17604 | 82.1708 | NaN | 1 | 0 |
| 35 | 36 | 0 | 1 | 0 | 3.0 | 1 | 0 | 113789 | 52.0000 | NaN | 0 | 0 |
| 36 | 37 | 1 | 3 | 0 | 2.0 | 0 | 0 | 2677 | 7.2292 | NaN | 1 | 0 |
| 37 | 38 | 0 | 3 | 0 | 1.0 | 0 | 0 | A./5. 2152 | 8.0500 | NaN | 0 | 0 |
| 38 | 39 | 0 | 3 | 1 | 1.0 | 2 | 0 | 345764 | 18.0000 | NaN | 0 | 1 |
| 39 | 40 | 1 | 3 | 1 | 0.0 | 1 | 0 | 2651 | 11.2417 | NaN | 1 | 1 |
| 40 | 41 | 0 | 3 | 1 | 3.0 | 1 | 0 | 7546 | 9.4750 | NaN | 0 | 2 |
| 41 | 42 | 0 | 2 | 1 | 2.0 | 1 | 0 | 11668 | 21.0000 | NaN | 0 | 2 |
| 42 | 43 | 0 | 3 | 0 | 2.0 | 0 | 0 | 349253 | 7.8958 | NaN | 1 | 0 |
| 43 | 44 | 1 | 2 | 1 | 0.0 | 1 | 2 | SC/Paris 2123 | 41.5792 | NaN | 1 | 1 |
| 44 | 45 | 1 | 3 | 1 | 1.0 | 0 | 0 | 330958 | 7.8792 | NaN | 2 | 1 |
| 45 | 46 | 0 | 3 | 0 | 2.0 | 0 | 0 | S.C./A.4. 23567 | 8.0500 | NaN | 0 | 0 |
| 46 | 47 | 0 | 3 | 0 | 2.0 | 1 | 0 | 370371 | 15.5000 | NaN | 2 | 0 |
| 47 | 48 | 1 | 3 | 1 | 1.0 | 0 | 0 | 14311 | 7.7500 | NaN | 2 | 1 |
| 48 | 49 | 0 | 3 | 0 | 2.0 | 2 | 0 | 2662 | 21.6792 | NaN | 1 | 0 |
| 49 | 50 | 0 | 3 | 1 | 1.0 | 1 | 0 | 349237 | 17.8000 | NaN | 0 | 2 |
facet = sns.FacetGrid(train, hue="Survived",aspect=4 )
facet.map(sns.kdeplot, 'Fare', shade = True)
facet.set(xlim = (0, train['Fare'].max()))
facet.add_legend()
plt.show()

facet = sns.FacetGrid(train, hue="Survived",aspect=4)
facet.map(sns.kdeplot,'Fare',shade= True)
facet.set(xlim=(0, train['Fare'].max()))
facet.add_legend()
plt.xlim(0, 20)
(0, 20)

for dataset in train_test_data:
    dataset.loc[dataset['Fare'] <= 17, 'Fare'] = 0,
    dataset.loc[(dataset['Fare'] > 17) & (dataset['Fare'] <= 30), 'Fare'] = 1,
    dataset.loc[(dataset['Fare'] > 30) & (dataset['Fare'] <= 100), 'Fare'] = 2,
    dataset.loc[dataset['Fare'] >= 100, 'Fare'] = 3
train.head()
| PassengerId | Survived | Pclass | Sex | Age | SibSp | Parch | Ticket | Fare | Cabin | Embarked | Title | |
|---|---|---|---|---|---|---|---|---|---|---|---|---|
| 0 | 1 | 0 | 3 | 0 | 1.0 | 1 | 0 | A/5 21171 | 0.0 | NaN | 0 | 0 |
| 1 | 2 | 1 | 1 | 1 | 3.0 | 1 | 0 | PC 17599 | 2.0 | C85 | 1 | 2 |
| 2 | 3 | 1 | 3 | 1 | 1.0 | 0 | 0 | STON/O2. 3101282 | 0.0 | NaN | 0 | 1 |
| 3 | 4 | 1 | 1 | 1 | 2.0 | 1 | 0 | 113803 | 2.0 | C123 | 0 | 2 |
| 4 | 5 | 0 | 3 | 0 | 2.0 | 0 | 0 | 373450 | 0.0 | NaN | 0 | 0 |
train.Cabin.value_counts()
B96 B98            4
G6                 4
C23 C25 C27        4
E101               3
C22 C26            3
D                  3
F2                 3
F33                3
B57 B59 B63 B66    2
E24                2
B20                2
B22                2
D17                2
C92                2
E33                2
E67                2
C52                2
F4                 2
B5                 2
B49                2
C65                2
D36                2
C93                2
C78                2
E25                2
B28                2
D33                2
D20                2
D35                2
B18                2
                  ..
C62 C64            1
B102               1
E46                1
B69                1
E68                1
C50                1
C106               1
D28                1
E50                1
D46                1
B19                1
C47                1
A24                1
C70                1
E36                1
C86                1
A34                1
C111               1
A32                1
D15                1
B101               1
A6                 1
B41                1
B94                1
B50                1
E17                1
C104               1
D56                1
B78                1
C95                1
Name: Cabin, Length: 147, dtype: int64
for dataset in train_test_data:
    dataset['Cabin'] =  dataset['Cabin'].str[:1]
Pclass1 = train[train['Pclass']==1]['Cabin'].value_counts()
Pclass2 = train[train['Pclass']==2]['Cabin'].value_counts()
Pclass3 = train[train['Pclass']==3]['Cabin'].value_counts()
df = pd.DataFrame([Pclass1, Pclass2, Pclass3])
df.index = ['1st class','2nd class', '3rd class']
df.plot(kind='bar',stacked=True, figsize=(10,5))
<matplotlib.axes._subplots.AxesSubplot at 0x2085f6b8748>

cabin_mapping = {"A": 0, "B": 0.4, "C": 0.8, "D": 1.2, "E": 1.6, "F": 2, "G": 2.4, "T": 2.8}
for dataset in train_test_data:
    dataset['Cabin'] = dataset['Cabin'].map(cabin_mapping)
# fill missing Fare with median fare for each Pclass
train["Cabin"].fillna(train.groupby("Pclass")["Cabin"].transform("median"), inplace=True)
test["Cabin"].fillna(test.groupby("Pclass")["Cabin"].transform("median"), inplace=True)
family Size
train["FamilySize"] = train["SibSp"] + train["Parch"] + 1
test["FamilySize"] = test["SibSp"] + test["Parch"] + 1
facet = sns.FacetGrid(train, hue="Survived",aspect=4)
facet.map(sns.kdeplot,'FamilySize',shade= True)
facet.set(xlim=(0, train['FamilySize'].max()))
facet.add_legend()
plt.xlim(0)
(0, 11.0)

family_mapping = {1: 0, 2: 0.4, 3: 0.8, 4: 1.2, 5: 1.6, 6: 2, 7: 2.4, 8: 2.8, 9: 3.2, 10: 3.6, 11: 4}
for dataset in train_test_data:
    dataset['FamilySize'] = dataset['FamilySize'].map(family_mapping)
train.head()
| PassengerId | Survived | Pclass | Sex | Age | SibSp | Parch | Ticket | Fare | Cabin | Embarked | Title | FamilySize | |
|---|---|---|---|---|---|---|---|---|---|---|---|---|---|
| 0 | 1 | 0 | 3 | 0 | 1.0 | 1 | 0 | A/5 21171 | 0.0 | 2.0 | 0 | 0 | 0.4 |
| 1 | 2 | 1 | 1 | 1 | 3.0 | 1 | 0 | PC 17599 | 2.0 | 0.8 | 1 | 2 | 0.4 |
| 2 | 3 | 1 | 3 | 1 | 1.0 | 0 | 0 | STON/O2. 3101282 | 0.0 | 2.0 | 0 | 1 | 0.0 |
| 3 | 4 | 1 | 1 | 1 | 2.0 | 1 | 0 | 113803 | 2.0 | 0.8 | 0 | 2 | 0.4 |
| 4 | 5 | 0 | 3 | 0 | 2.0 | 0 | 0 | 373450 | 0.0 | 2.0 | 0 | 0 | 0.0 |
features_drop = ['Ticket','SibSp','Parch']
train = train.drop(features_drop, axis = 1)
test = test.drop(features_drop,axis=1)
train = train.drop(['PassengerId'], axis=1)
train_data = train.drop('Survived', axis = 1)
target = train['Survived']
train_data.shape, target.shape
((891, 8), (891,))
train_data.head(10)
| Pclass | Sex | Age | Fare | Cabin | Embarked | Title | FamilySize | |
|---|---|---|---|---|---|---|---|---|
| 0 | 3 | 0 | 1.0 | 0.0 | 2.0 | 0 | 0 | 0.4 |
| 1 | 1 | 1 | 3.0 | 2.0 | 0.8 | 1 | 2 | 0.4 |
| 2 | 3 | 1 | 1.0 | 0.0 | 2.0 | 0 | 1 | 0.0 |
| 3 | 1 | 1 | 2.0 | 2.0 | 0.8 | 0 | 2 | 0.4 |
| 4 | 3 | 0 | 2.0 | 0.0 | 2.0 | 0 | 0 | 0.0 |
| 5 | 3 | 0 | 2.0 | 0.0 | 2.0 | 2 | 0 | 0.0 |
| 6 | 1 | 0 | 3.0 | 2.0 | 1.6 | 0 | 0 | 0.0 |
| 7 | 3 | 0 | 0.0 | 1.0 | 2.0 | 0 | 3 | 1.6 |
| 8 | 3 | 1 | 2.0 | 0.0 | 2.0 | 0 | 2 | 0.8 |
| 9 | 2 | 1 | 0.0 | 2.0 | 1.8 | 1 | 2 | 0.4 |
5. Modelling
# Importing Classifier Modules
from sklearn.neighbors import KNeighborsClassifier
from sklearn.tree import DecisionTreeClassifier,ExtraTreeClassifier
from sklearn.ensemble import RandomForestClassifier,ExtraTreesClassifier,BaggingClassifier,AdaBoostClassifier,GradientBoostingClassifier
from sklearn.naive_bayes import GaussianNB
from sklearn.svm import SVC

import numpy as np
train.info()
<class 'pandas.core.frame.DataFrame'>
RangeIndex: 891 entries, 0 to 890
Data columns (total 9 columns):
Survived      891 non-null int64
Pclass        891 non-null int64
Sex           891 non-null int64
Age           891 non-null float64
Fare          891 non-null float64
Cabin         891 non-null float64
Embarked      891 non-null int64
Title         891 non-null int64
FamilySize    891 non-null float64
dtypes: float64(4), int64(5)
memory usage: 62.7 KB
6.Cross Validation(k-fold)
from sklearn.model_selection import KFold
from sklearn.model_selection import cross_val_score
k_fold = KFold(n_splits=10, shuffle=True, random_state=0)
clf = KNeighborsClassifier(n_neighbors = 13)
scoring = 'accuracy'
score = cross_val_score(clf, train_data, target, cv=k_fold, n_jobs=1, scoring=scoring)
print(score)
[0.82222222 0.76404494 0.80898876 0.83146067 0.87640449 0.82022472
 0.85393258 0.79775281 0.84269663 0.84269663]
#learning_rates = [0.05, 0.1, 0.25, 0.5, 0.75, 1]
clf = [KNeighborsClassifier(n_neighbors = 13),DecisionTreeClassifier(),
       RandomForestClassifier(n_estimators=13),GaussianNB(),SVC(),ExtraTreeClassifier(),
      GradientBoostingClassifier(n_estimators=10, learning_rate=1,max_features=3, max_depth =3, random_state = 10),AdaBoostClassifier(),ExtraTreesClassifier()]
def model_fit():
    scoring = 'accuracy'
    for i in range(len(clf)):
        score = cross_val_score(clf[i], train_data, target, cv=k_fold, n_jobs=1, scoring=scoring)
        print("Score of Model",i,":",round(np.mean(score)*100,2))
#     round(np.mean(score)*100,2)
#     print("Score of :\n",score)
model_fit()
Score of Model 0 : 82.6
Score of Model 1 : 79.8
Score of Model 2 : 80.92
Score of Model 3 : 78.78
Score of Model 4 : 83.5
Score of Model 5 : 80.02
Score of Model 6 : 81.25
Score of Model 7 : 81.03
Score of Model 8 : 80.7
clf1 = SVC()
clf1.fit(train_data, target)
test
test_data = test.drop(['Survived','PassengerId'], axis=1)
prediction = clf1.predict(test_data)
# test_data
test_data['Survived'] = prediction
submission = pd.DataFrame(test['PassengerId'],test_data['Survived'])
submission.to_csv("Submission.csv")
Metadata
Owner
Metadata
Start here if... You're new to data science and machine learning, or looking for a simple intro to the Kaggle prediction competitions. Competition Description The sinking of the RMS Titanic is one of...