openfold
 openfold copied to clipboard
About Initial Training and Finetune Training Speed
Environment:
pytorch-lightning==1.5.10 torch==1.10.0+cu113 deepspeed==0.5.9 CUDA Version: 11.2.142 Driver Version: 460.32.03 CUDNN: 8.20.00 [torch.backends.cudnn.version(), 8200] NCCL: 2.10.3 [torch.cuda.nccl.version(), (2, 10, 3)]
git commit 24118e804535515398e77010e11b1312f6ff1b62 & Date: Fri May 13 13:59:38 2022 -0400
Install command:
git clone https://github.com/aqlaboratory/openfold.git
python setup.py develop
Training Scripts:
# --config_preset initial_training or finetuning
# only one sample in training dataset
# note: template_mmcif_dir is equal to mmcif_dir
python train_openfold.py data/mmcif/ data/alignment/ data/mmcif/ output_dir \
	2021-10-10 \
   --config_preset finetuning \
   --template_release_dates_cache_path data/mmcif_cache.json \
   --precision bf16 \
   --deepspeed_config_path deepspeed_config.json \
   --gpus 1 \
   --seed 42 \
   --checkpoint_every_epoch \
   --train_chain_data_cache_path data/chain_data_cache.json \
   --train_mapping_path data/protein_id.mapping
The performance results:
| config_preset | DType | GPUs(40G) | Step | Time (s/step) | Min Memory | Max Memory |
|---|---|---|---|---|---|---|
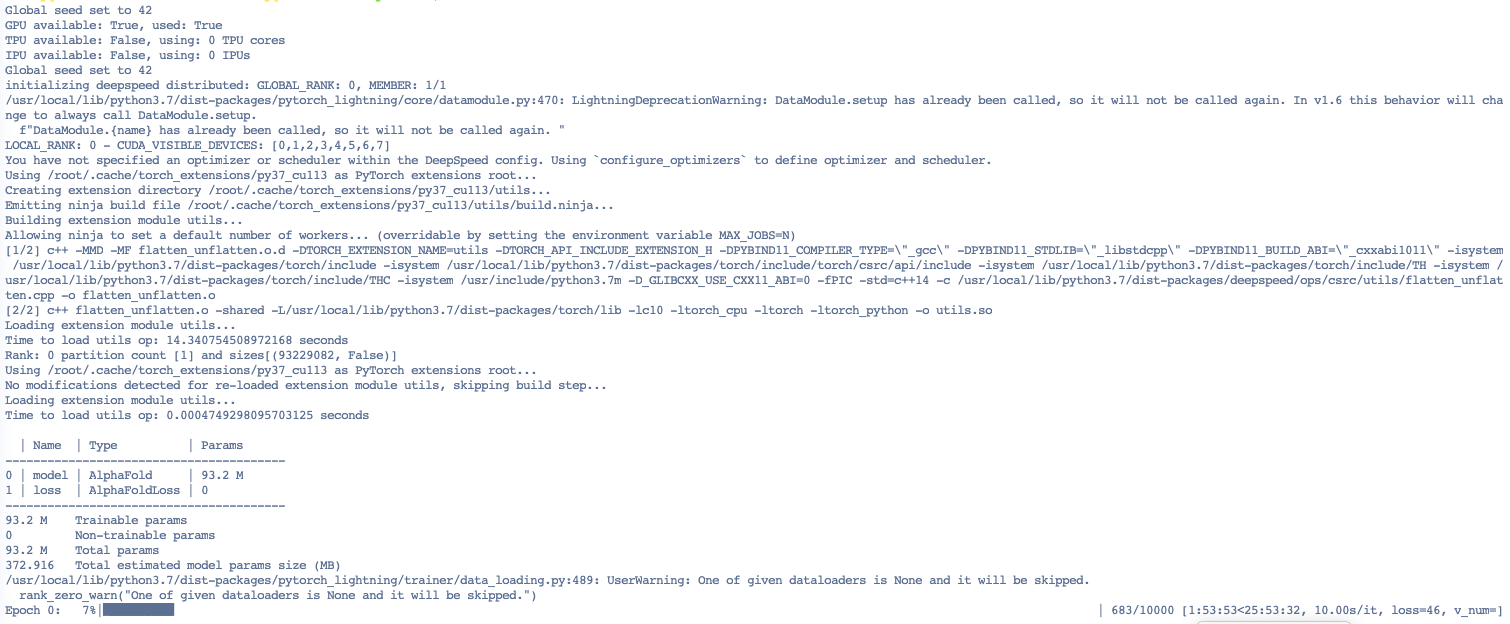
| initial_training | BF16 | 1*A100 | 1000 | 10.28 | 5162MiB / 40536MiB | 10960MiB / 40536MiB |
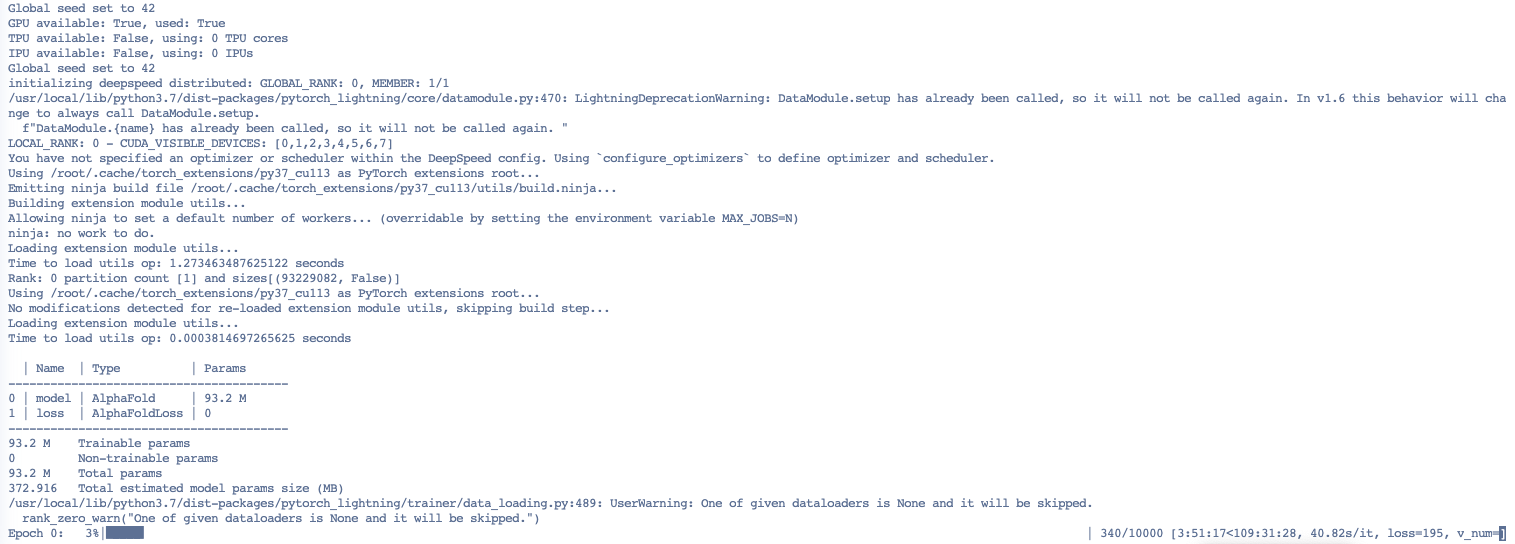
| finetuning | BF16 | 1*A100 | 340 | 40.82 | 28040MiB / 40536MiB | 39628MiB / 40536MiB |
initial_training Screenshot:
finetuning Screenshot:
Can you confirm if the speed is right? I
These times are a lot slower than what I'm seeing on our A100s. I'm getting ~8.9 seconds per initial_training iteration during our current 40 GPU training run. Single-GPU times are faster, closer to 8 seconds per iteration. Single-GPU finetuning iterations take about 20-25 seconds each.
I'm effectively using the same command as you, just with the --benchmark flag, which runs CUDNN benchmarking, purportedly speeding up the network a little.
I have
pytorch-lightning==1.5.10 torch==1.10.1+cu113 deepspeed==0.5.9 CUDA Version: 11.4 Driver Version: 470.82.01 CUDNN: 8.2.4.15 NCCL: 2.10.3
Others have reported faster times still; see e.g. https://arxiv.org/pdf/2203.00854.pdf, where they claim times of 6.2s/20.7s for the two respective config settings on 128 A100s. A separate third party has also reported distributed A100 times between 6 and 7 seconds to me. I've personally been unable to reach such times.
Some questions:
- ~~Are you using the most recent OpenFold commit?~~ (just noticed you gave a hash)
- How many dataloader workers are you using? Data processing seems to be the closest thing to a bottleneck for us.
- If you have the time, could you run some simple profiles? E.g. the forward pass time, the time for generating each batch, the default torch profiler.
@gahdritz
Answer the question:
2. I use the default config, so I use num_workers=16. I try to save a new_batch.pickle and use data_module = DummyDataLoader("new_batch.pickle") and get the same speed.
3. I am newer for openfold, I think I need some time to add profile code. If I product profiler files and paste to here.
I try to reproduce your performance "closer to 8 seconds per iteration for initial_training and 20-25 seconds per iteration for finetuning on single-GPU.
When I set max_recycling_iters=0 in config.py to disable recycle. I got the closer results. So If you set max_recycling_iters=0 to test the performance?
| config_preset | DType | GPUs(40G) | max_recycling_iters | Step | Time (s/step) | Min Memory | Max Memory |
|---|---|---|---|---|---|---|---|
| initial_training | BF16 | 1*A100 | 3 | 1000 | 10.28 | 5162MiB / 40536MiB | 10960MiB / 40536MiB |
| finetuning | BF16 | 1*A100 | 3 | 340 | 40.82 | 28040MiB / 40536MiB | 39628MiB / 40536MiB |
| initial_training | BF16 | 1*A100 | 0 | 100 | 8.04 | - | - |
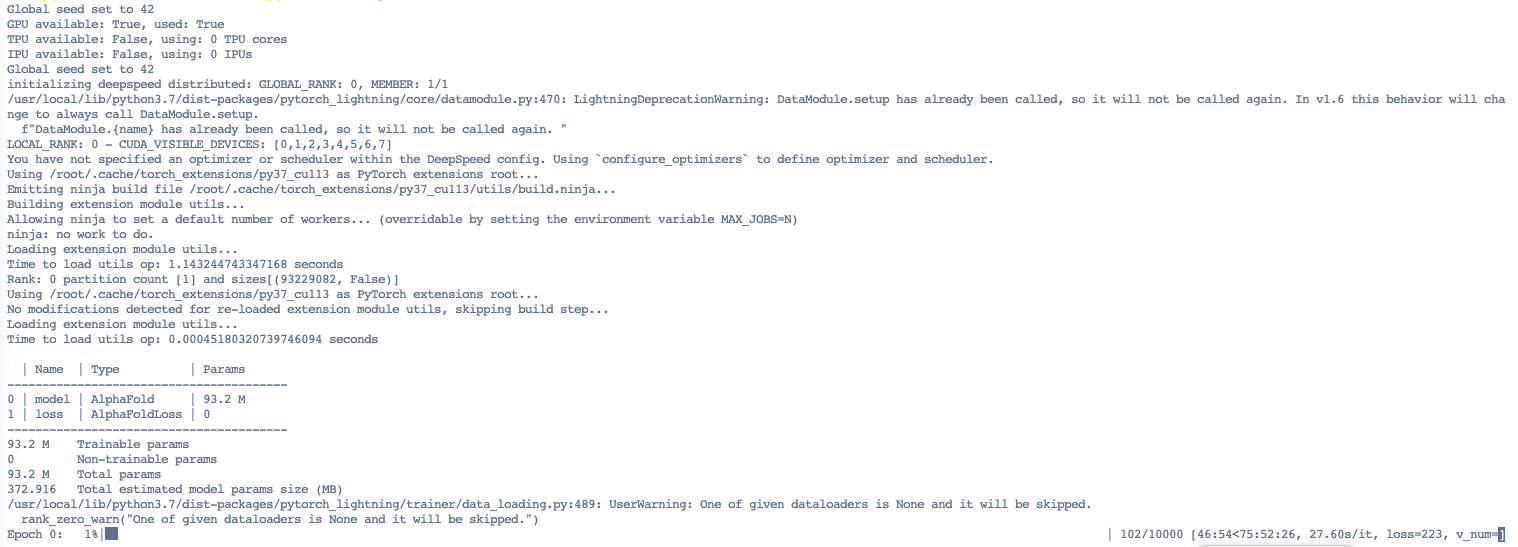
| finetuning | BF16 | 1*A100 | 0 | 100 | 27.60 | - | - |
initial_training

finetuning
Reducing the number of recycling iterations will make it faster, but my figures were obtained with the default setting, i.e. with max_recycling_iters = 3 and uniform_recycling=True (that second option randomly chooses a number of recycling iterations between 0 and the maximum, like AlphaFold does during training). How many CPU cores do you have available per GPU? I've noticed that my performance degrades a little when I have fewer CPUs than dataloader workers.