G2Plot
 G2Plot copied to clipboard
🐛 [BUG] latest g2plot 版本中 x, y 轴数据不是满射
🐛 Bug description [Please make everyone to understand it]
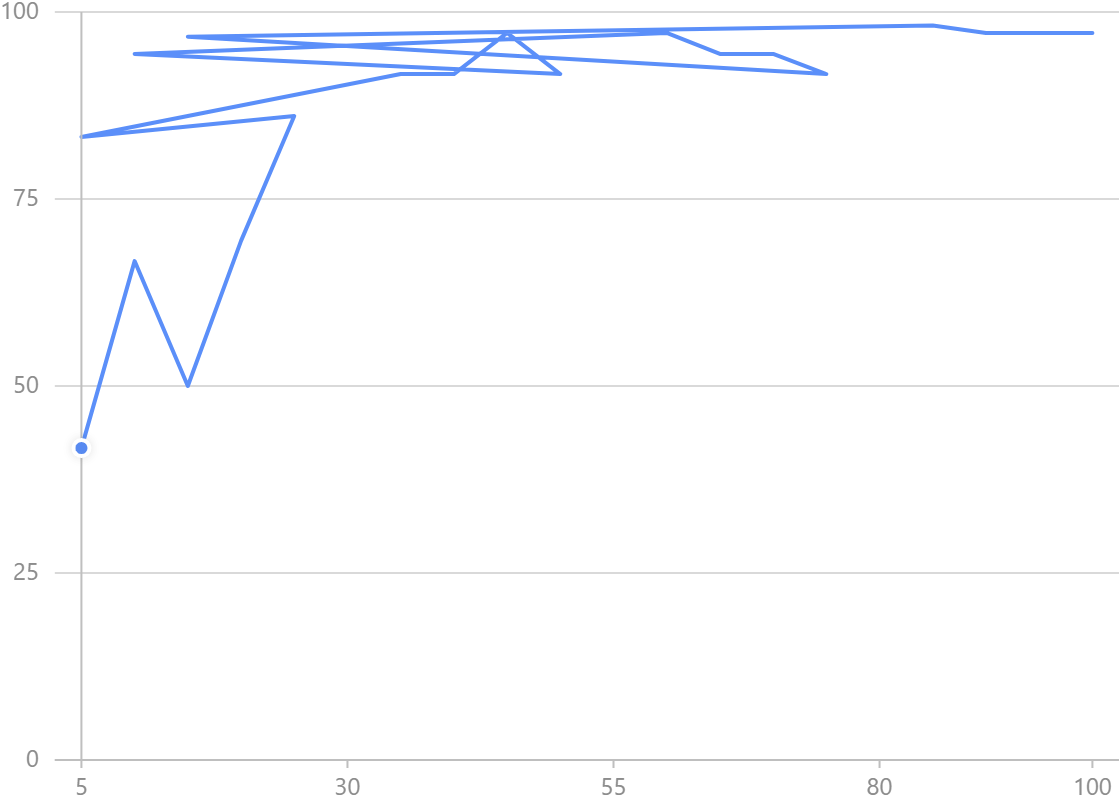
不同的 x 数据,会对应到同一个 x 点上,比如 x=1, y=1, x=2,y=2,图中会出现 x=1,y=1, x=1,y=2 的情况
Please provide a link by forking these links G2Plot or GitHub repo, a minimal reproduction.
- Required Link to minimal reproduction: https://codesandbox.io/s/g2plot-issue-template-forked-pfj5vd
📷 Step to reproduce
run reproduction
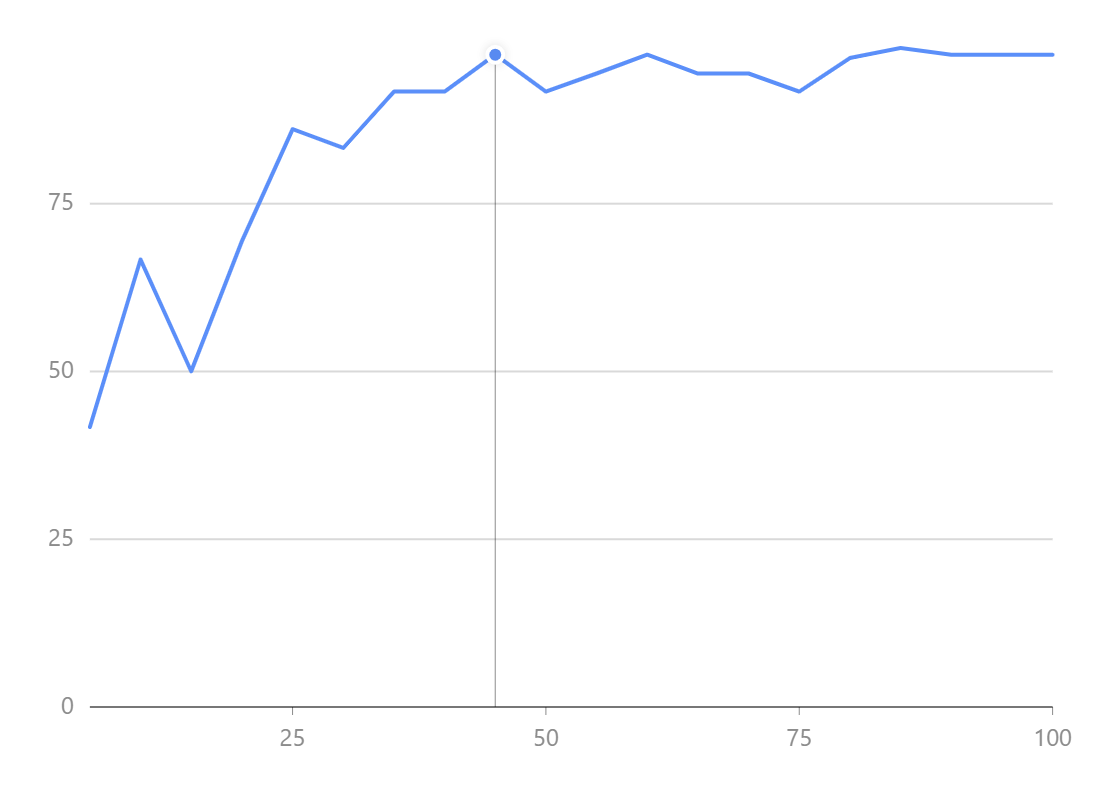
🏞 Expected result
🚑 Any additional [like screenshots]
- G2Plot Version: latest, 2.3.35 也有,其他版本未测
- Platform: codesandbox
- 文档上的 examples 也有这些问题,不仅是 折线图,柱状图也是有的
Thanks a log, this was a very hard issue to find an answer for as I don't know Chinese (yet) :) Leaving some keywords here ...
Inaccurate Y-values Representation on Line Chart for Unique X-axis Data Points
I am experiencing an issue with G2Plot where my line chart does not accurately represent y-values according to the provided dataset. Despite having distinct y-values for different x-axis points in my dataset, the chart incorrectly displays multiple x-axis points as having the same y-value. This visual inconsistency does not align with the data input, suggesting a possible bug in the rendering or data processing logic of the chart