altair
 altair copied to clipboard
Adding an example where mark_trail is used to draw a vector field
I am new to altair and the open source community in general, but I thought I might have a valuable (debatable) example to add to the altair documentation.
As a mathematician, I often find myself drawing vector fields. Here's an image from Wikipedia:
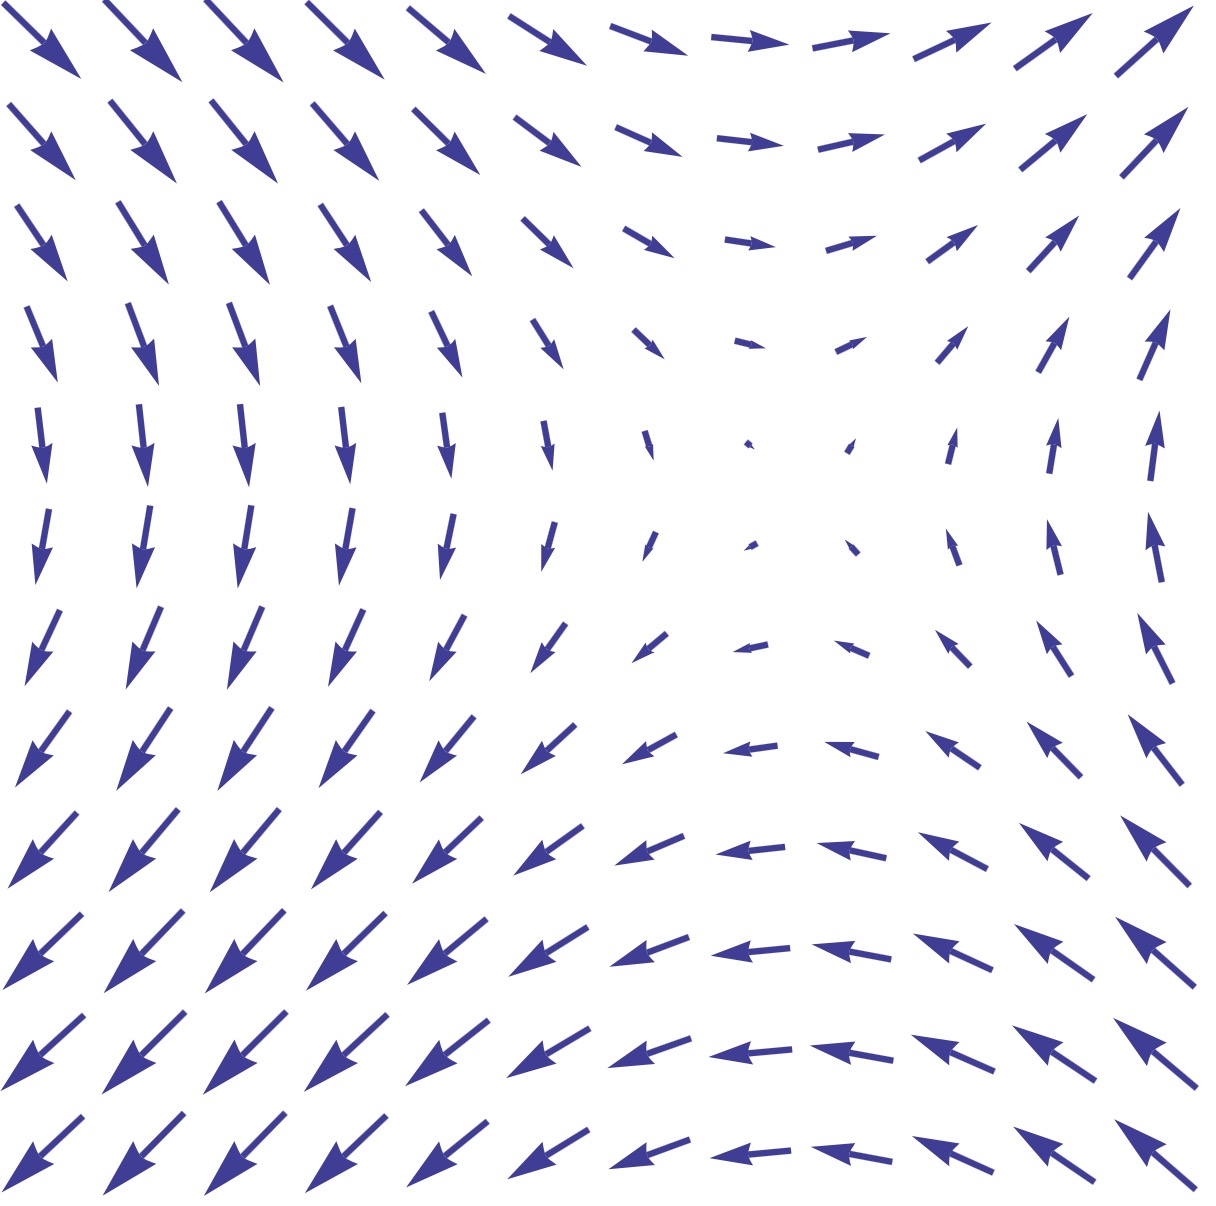 At every point in space (x,y) the vector indicates the direction of the vector field. Now,
 altair does not have a mark_arrow, but I found mark_trail to be a great substitute here:
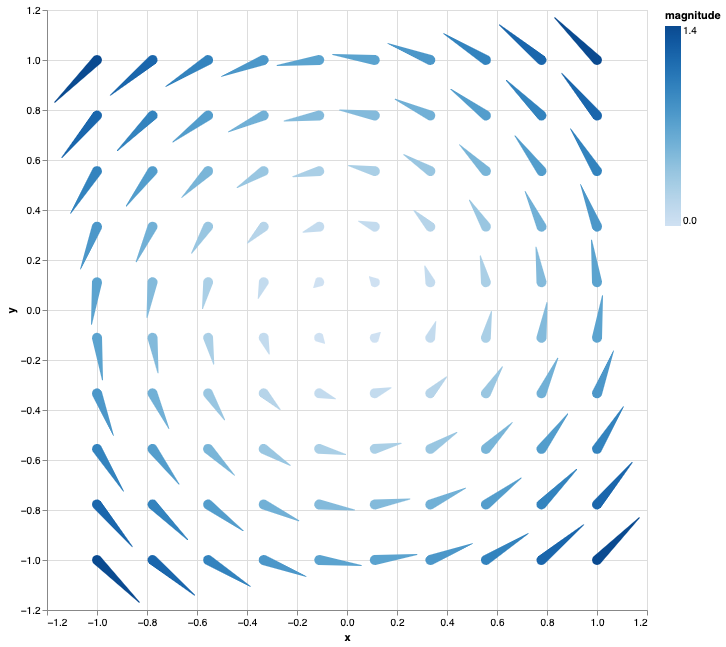
I was wondering whether it would make sense to have this as an example in the gallery. If yes, I'd be happy to work on a (my first) PR. Here's the code that I used to generate that plot.
def vector_field(x, y):
    return -np.sin(y), np.sin(x)


n = 10
x = np.linspace(-1, 1, n)
y = np.linspace(-1, 1, n)
X0, Y0 = np.meshgrid(x, y)
dX, dY = vector_field(X0, Y0)

length = 0.2
X1, Y1 = X0 + length * dX, Y0 + length * dY

width0 = 1
width1 = 0

id = np.arange(n**2)

df0 = pd.DataFrame(
    {
        "id": id,
        "width": width0,
        "x": X0.flatten(),
        "y": Y0.flatten(),
        "magnitude": dX.flatten()**2 + dY.flatten()**2,
    }
)

df1 = pd.DataFrame(
    {
        "id": id,
        "width": width1,
        "x": X1.flatten(),
        "y": Y1.flatten(),
        "magnitude": dX.flatten()**2 + dY.flatten()**2,
    }
)

df = pd.concat([df0, df1])

chart = (
    alt.Chart(df)
    .mark_trail()
    .encode(
        x="x",
        y="y",
        size=alt.Size("width", legend=None, scale=alt.Scale(range=[0, 10])),
        detail="id",
        color=alt.Color("magnitude:Q"),
    )
    .properties(width=600, height=600)
)
chart
Thank you for reaching out @thomascamminady. That seems like a great example to have in the example gallery!
I am aware that there is a wind vector map in the geo-section of the examples: https://altair-viz.github.io/gallery/wind_vector_map.html.
Can you check if the approach there, mark_point(shape="wedge", filled=True) including an angle and size encoding channel would work for your use-case as well?
I'm not certain which approach is preferable, but if you still think that mark_trail() has additional benefits than we should add your current approach.
Thanks again for reaching out!
I have to admit that I missed the wind vector map completely. I will have a look into the differences and report back.
That probably means that you are not working with spatial data? Also meaning that your vector fields example is still useful in another category.
I think I can create a visualization using the mark_point(shape="wedge") mark that does what I wanted to achieve. I see no advantage using mark_trail.
You're right that I am not working with spatial data. That is probably why I skipped over that example. I'd be happy to put up an example similar to what I wrote down above, but using mark_point.
Maybe with some extra content, this could live in the "Case Studie" section of the example gallery.
If this sounds like I good idea, I'd go ahead and start implementing this example and put up a PR. I might need help at one point because this is my first contribution to Altair, but I'd gladly get started.
That would be great! We have tried to document how to contribute at this page, https://github.com/altair-viz/altair/blob/master/CONTRIBUTING.md. If you face any difficulties, just send me a message and I will try to assist.
(another recent PR including a new example that you can use as reference is the following: https://github.com/altair-viz/altair/pull/2882)
I realized when writing this out, that I made have expanded the scope of an example too much. This first Colab notebook contains my example for the predator prey model. I added some markdown remarks which I would convert into smaller comments for the actual example, but even then this is quite some code. Not sure if I should leave out some parts.
Also note that I am using scipy which I realized I might not be able to do. I can replace the scipy.integrate.odeint call with a simple implementation using numpy but that would add another 5ish lines.
If I leave out solving the differential equation and only plot the vector field, the code would reduce in scope, but I also feel that the example might lose value.
Happy to hear some feedback :)
Cool notebook! Thanks for working on this @thomascamminady ! I think this could fit as a turotial/case study, which we currently only have one of so that would be great it think. I wonder if we can add scipy to the doc build, I actually have an example tutorial in mind myself that I want to add and that also relies on scipy.
If we don't think adding scipy is a good idea, another option would be to put the notebook in a Github pages and link to it in the showcase section of the docs that I want to add eventually (see the pinned issue).
Yet another, more versatile, option would be if we had a section that allowed submissions that contianed packages outside the doc build requirements (and maybe also external data) by using executed notebooks with output stored in them. This would make it easier to make these submissions and we could have a "requirements_extra" file that we used to rerun these notebooks for major releases, but that didn't need to be executed each time we built the docs.
I have been thinking about this for a while in terms of an easy solution to showcase more intricate examples that interplay with other packages in the docs, but I'm not sure what's the best solution here so curious what others think.
Really nice notebook @thomascamminady! Love it.
Two suggestions for the visualization (very well done btw!):
- If you add
domainMid=0as attribute to the scale for the color of the point-wedges, you'll have diverging colors, as such
color=alt.Color("Population Change:Q").scale(domainMid=0)
- When https://github.com/vega/vega-lite/issues/7854 is resolved in altair, I think you can do
.mark_line(point=True)and then you should be able to define anearest=Truein the selection (thenearesttransform is not supported for pure line marks).
I don't mind adding scipy to the doc-build, but will it be necessary? I've the feeling we can follow the same strategy as the comet chart example, https://altair-viz.github.io/gallery/comet_chart.html. That example has a reference in the description to a blog post with a more detailed explanation. Maybe we can do the same here too. With that approach there will be still two things unclear.
- Can the data be defined without the scipy modelling?
- Where will the reference notebook be located?
We can think with you for both of these questions, but maybe you have something in mind already.
Again, thanks for this example. Looking forward to find a way to include this somehow in the docs!
Edit: @joelostblom, I agree that we should have more material as tutorials, but I don't think this example is suitable for the tutorial-section. Therefor it should contain a more exploratory approach using numerous visualizations.