altair
 altair copied to clipboard
Provide a method to get a valid projection
When using Altair for plotting geographic objects, the visualization automatically chooses an appropriate projection. However if we overlay another object, I would like to rescale / crop the chart to have a better zoomed view
Example:
import altair as alt
# inspired by: https://altair-viz.github.io/gallery/london_tube.html

london_boroughs_url = 'https://raw.githubusercontent.com/vega/vega-datasets/next/data/londonBoroughs.json'
boroughs_centroids_url = 'https://raw.githubusercontent.com/vega/vega-datasets/next/data/londonCentroids.json'

boroughs = alt.topo_feature(london_boroughs_url, 'boroughs')


background = alt.Chart(boroughs).mark_geoshape(
    stroke='white',
    strokeWidth=2
).encode(
    color=alt.value('#eee'),
)

labels = alt.Chart(boroughs_centroids_url).mark_text().encode(
    longitude='cx:Q',
    latitude='cy:Q',
    text='bLabel:N',
    size=alt.value(8),
    opacity=alt.value(0.6)
).transform_calculate(
    "bLabel", "indexof (datum.name,' ') > 0  ? substring(datum.name,0,indexof(datum.name, ' ')) : datum.name"
)

london = background + labels
print(london.projection) # undefined !!
display(london)
The above display returns the following image:
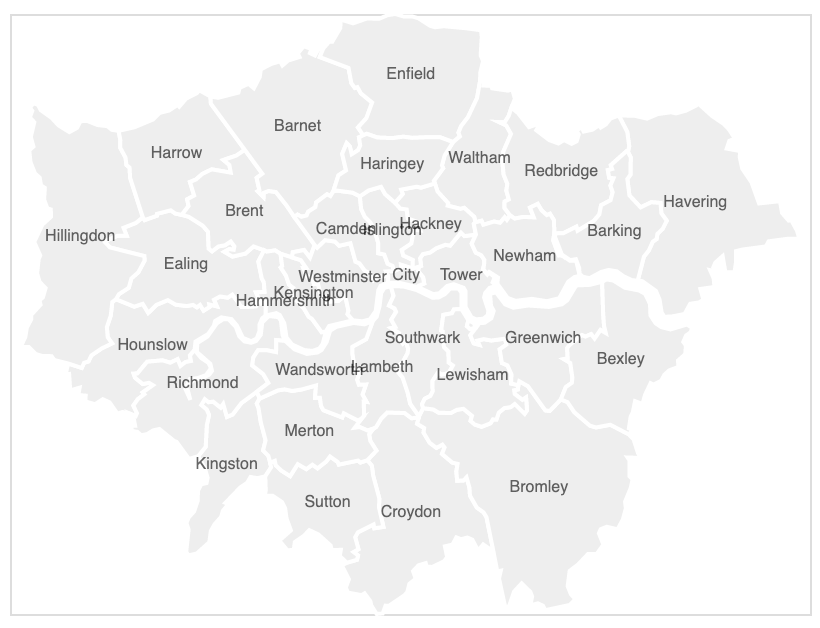
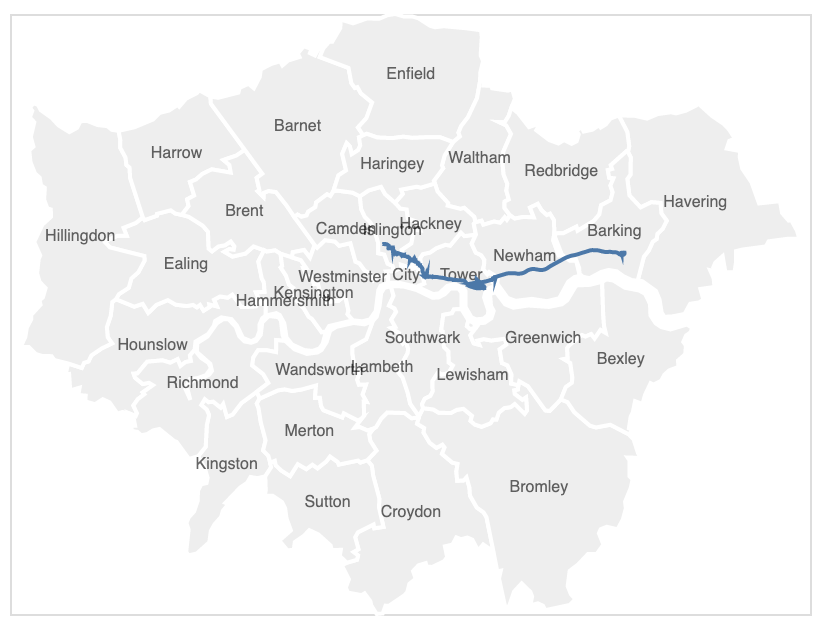
Where an appropriate projection has been chosen. If I add an additional object on the chart.
# source = ....
points = alt.Chart(source).mark_line().encode(
        longitude='longitude_degs:Q',
        latitude='latitude_degs:Q', order='index')
chart = london + points
display(chart)
The projection chosen is based on the largest fitting projection. However I would like to "zoom" in on the smaller object
Something along the lines of:
chart = (london + points).project(points.projection)
But of course, points.projection is also undefined.
Please follow these steps to make it more efficient to respond to your feature request.
- [ ] Since Altair is a Python wrapper around the Vega-Lite visualization grammar, most feature requests should be reported directly to Vega-Lite. You can click the Action Button of your Altair chart and "Open in Vega Editor" to create a reproducible Vega-Lite example.
- [x] Search for duplicate issues.
- [x] Describe the feature's goal, motivating use cases, and its expected behavior.
I can manually find an appropriate scale but this is not automated:
long_domain = source['longitude_degs'].agg([min, max]).tolist()
lat_domain = source['latitude_degs'].agg([min, max]).tolist()
center = ((long_domain[0] + long_domain[1]) / 2, (lat_domain[0] + lat_domain[1]) / 2, )
points = alt.Chart(source).mark_line().encode(
    longitude='longitude_degs:Q',
    latitude='latitude_degs:Q',
    order='index')
chart = (london + points).project(center=center, scale=80000)
display(chart)

This may be a better question for the vega-lite repository – Altair doesn't have access to the necessary information to auto-generate domains
@jakevdp is seems that a fit option can be given to Vega-Lite. Is this feature available in Altair?
https://github.com/vega/vega-lite/issues/7448
This works for me on the development version of Altair:
import altair as alt
from vega_datasets import data

source = alt.topo_feature(data.world_110m.url, 'countries')
features = [
        {
          "geometry": {
            "coordinates": [[[-3, 52], [4, 52], [4, 45], [-3, 45], [-3, 52]]],
            "type": "Polygon"
          },
          "type": "Feature"
        },
        {
          "geometry": {
            "coordinates": [[[-3, 59], [4, 59], [4, 52], [-3, 52], [-3, 59]]],
            "type": "Polygon"
          },
          "type": "Feature"
        }
]
alt.Chart(source).mark_geoshape(clip=True).project(fit=features)

@thomassajot There is a new page in the documentation on the geoshape mark including how to use project(fit=...). Does this resolve your original inquiry or do you think there is something still missing?