altair
 altair copied to clipboard
Selection Chart can't run independently
I have the following code for displaying the data:
brush = alt.selection(type='interval')
points = alt.Chart(houses_prices).mark_point(opacity=0.2).encode(
x='id:Q',
y='SalePrice:Q',
color=alt.condition(brush, alt.value('blue'), alt.value('lightgray'))
).add_selection(
brush
)
qual = alt.Chart(houses_prices).mark_bar().encode(
alt.Y('OverallQual:N', axis=alt.Axis()),
x='count(OverallQual):Q'
).transform_filter(
brush
)
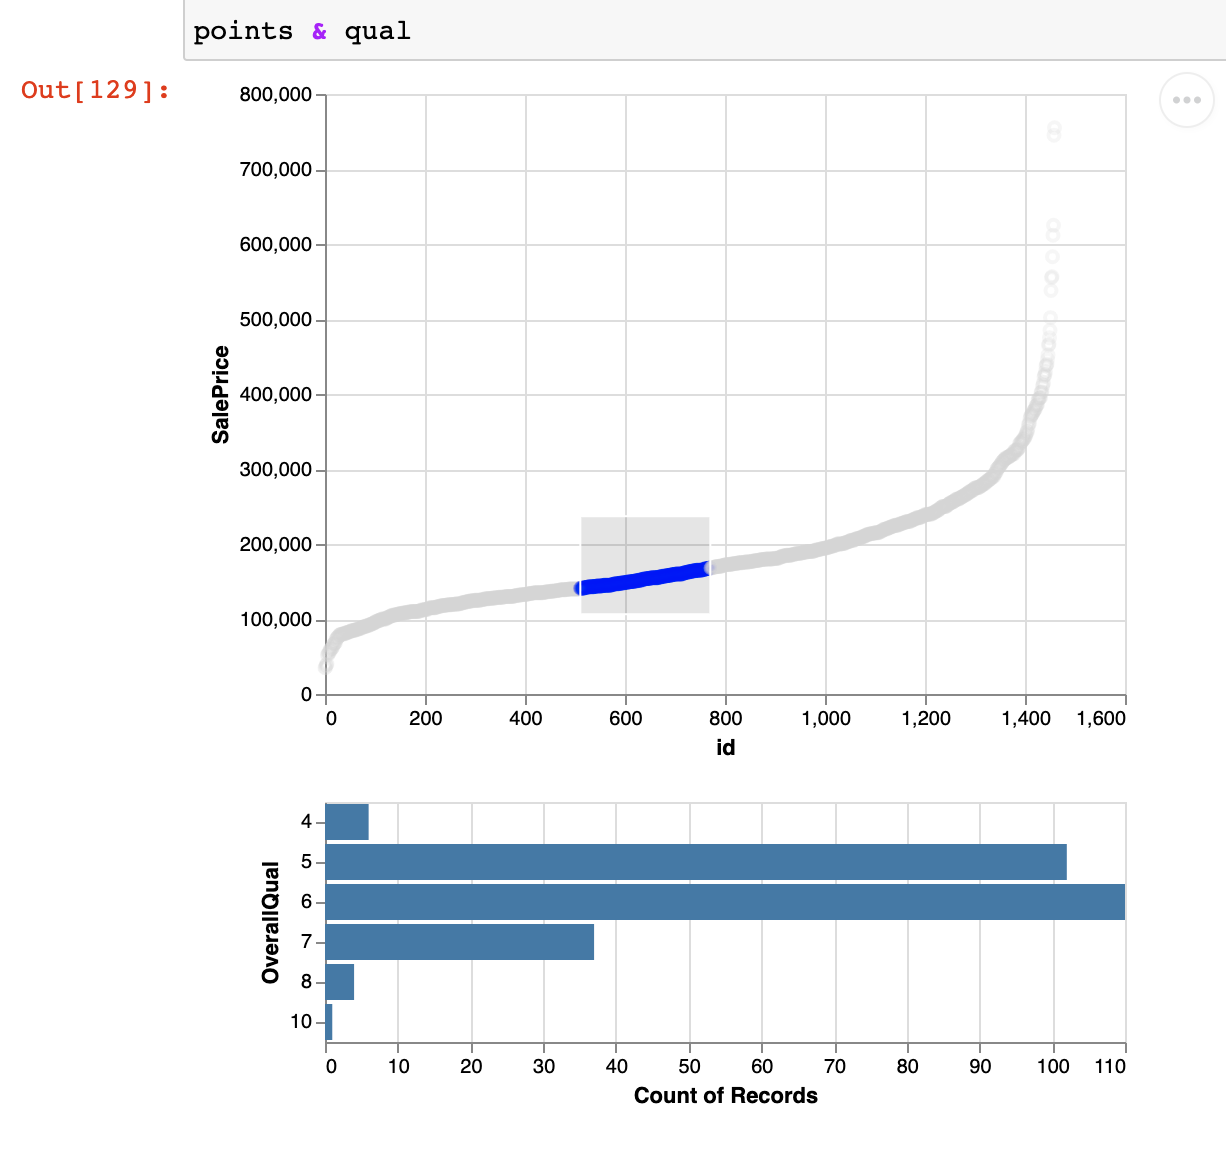
points & qual
house_prices is a pandas DataFrame.
This code runs well and produces the following output:
However I want the possibility to run points and qual separately. If I run qual on its own (with points initialized) the following error ocurres:
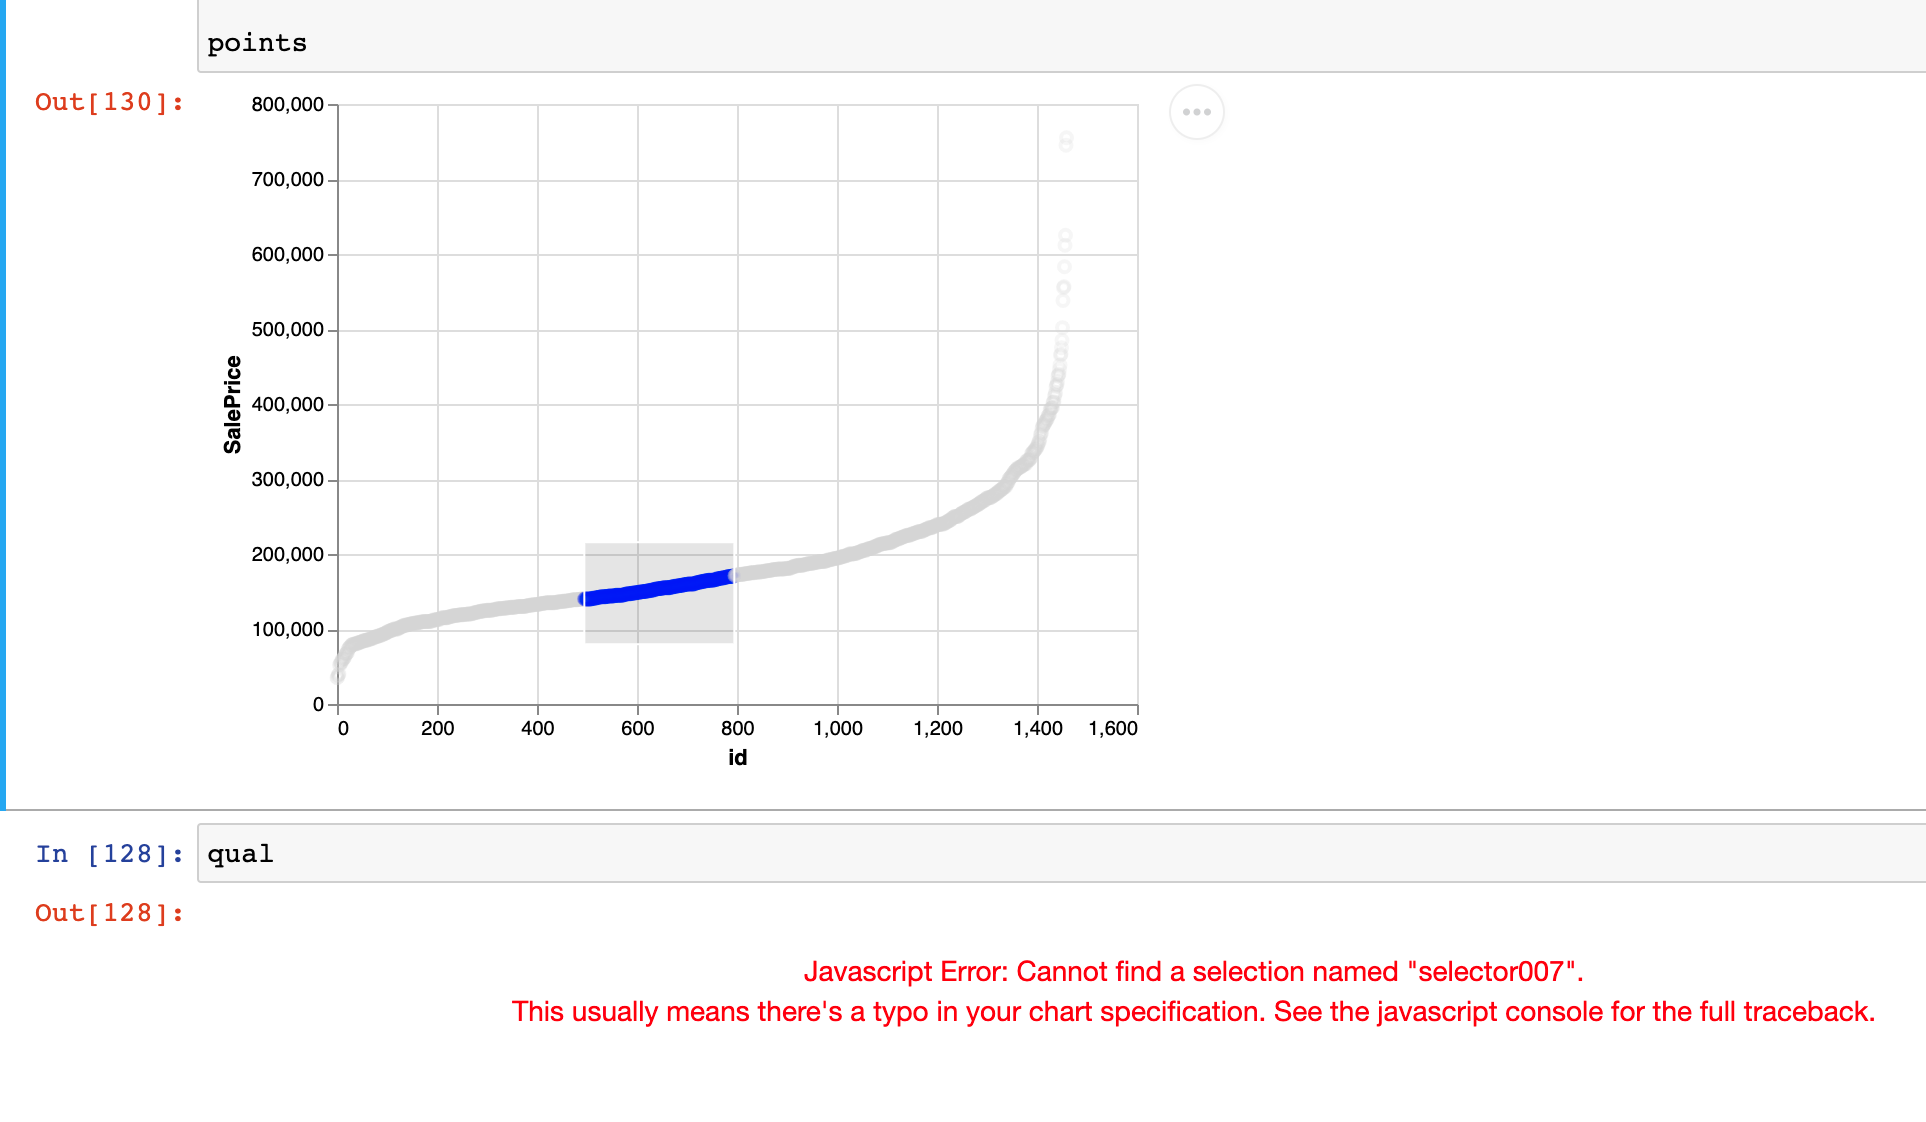
I would like this functionality because if I have lots of selections, the way they are displayed has to be more carefully.
It is because you have added the selection only to the points chart. qual.add_selection(brush) should work in a new cell.
It is because you have added the selection only to the
pointschart.qual.add_selection(brush)should work in a new cell.
It doesn't produce any error but the chart doesn't update in realtime as selection in points varies
Altair doesn't provide any facility to link selection behavior between different charts. If you want that behavior, you have to concatenate them into a single chart.
I believe that what you want to do can be done with vega-level signals implemented in JavaScript, but I don't know of any examples of doing it.
Selections only work on objects in the same Altair/VegaLite view. If you display the charts separately, then selections in the points chart will not update the qual chart.
I understand. I don't know how easy or hard would be to enable that functionality in the library or if more people find it useful. I will not try to display them separetely if the library doesnt allow that. Thanks for your time.