Influxdb 2.X issue recovering query name in 'Apply to metrics'
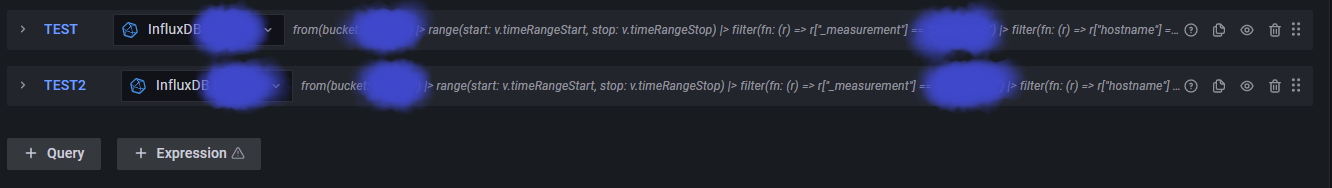
Hello, working with influxdb 2.X the query name is not recovered correctly. When defining a new rule, in the field 'Apply to metrics' i should have a list with the name of the queries written, instead is proposed a list of query (the number is correct) but the name is not the one given to the queries. It seems is reported the tag value selected and an hashmap composed by all the tag key of the measurement. With an high number of queries is very difficult to manage and setup the weathermap but the greater issue is that this name is shown also in the graph tooltip name. The issue seems to be related to the fact that the older Grafana Influxdb datasource was using a field named 'Alias' to set the name of the query. In this latest datasource, if you use the Flux language, you do not have this field 'alias' to set the query name. I'm reporting here below a couple of screenshot and the way to reproduce the issue.
Grafana: 8.3.3 Grafana InfluxDB plugin: 5.00 (latest) Influxdb: 2.1.1 Flowcharting plugin: 0.9.1 latest release
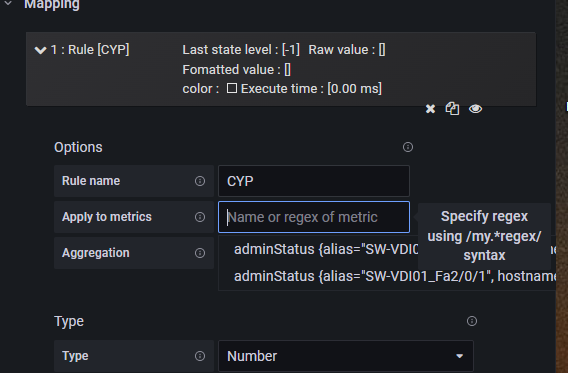
Hi Francesco, Unfortunate that flux doesn't have the alias field, I would propose to issue a feature request in grafana since influx is one of the core plugins. Don't think flowcharting can do anything about this, it is simply re-using the metric functionality of the available datasources. When there is no alias, the metric name will probably be generated in a structured way, you may be able to use a regular expression in the rule to match it (e.g. /SW-VIDI.*1/). You can see the metric names and associated values when you inspect the panel data, in the flowcharting rule you normally get a list of metric names when you start typing. You could use the newest flowcharting snapshot for improved functionality. Kind regards, Dennis
Hello Dennis, very sorry for the late answer. Thnak for the information you gave me, I’ve opened a new topic I the GrafanaLabs community:
https://community.grafana.com/t/influx-with-flux-issue-with-flowcharting-plugin/60779
I’m using the opensource version of Grafana, do you think I can issue a feature request? Do you know ehere I can do this? (I’ve not found any specific in the Grafana website)
regards Francesco
Da: Dennis @.> Inviato: lunedì 31 gennaio 2022 10:56 A: algenty/grafana-flowcharting @.> Cc: Francesco Toffoli @.>; Author @.> Oggetto: Re: [algenty/grafana-flowcharting] Influxdb 2.X issue recovering query name in 'Apply to metrics' (Issue #329)
Hi Francesco, Unfortunate that flux doesn't have the alias field, I would propose to issue a feature request in grafana since influx is one of the core plugins. Don't think flowcharting can do anything about this, it is simply re-using the metric functionality of the available datasources. When there is no alias, the metric name will probably be generated in a structured way, you may be able to use a regular expression in the rule to match it (e.g. /SW-VIDI.*/1/). You can see the metric names and associated values when you inspect the panel data, in the flowcharting rule you normally get a list of metric names when you start typing. You could use the newest flowcharting snapshot for improved functionality. Kind regards, Dennis
— Reply to this email directly, view it on GitHubhttps://github.com/algenty/grafana-flowcharting/issues/329#issuecomment-1025557787, or unsubscribehttps://github.com/notifications/unsubscribe-auth/AN4YVXRT5KM5UWUZ2T6WGLTUYZMDRANCNFSM5MXUQVVA. Triage notifications on the go with GitHub Mobile for iOShttps://apps.apple.com/app/apple-store/id1477376905?ct=notification-email&mt=8&pt=524675 or Androidhttps://play.google.com/store/apps/details?id=com.github.android&referrer=utm_campaign%3Dnotification-email%26utm_medium%3Demail%26utm_source%3Dgithub. You are receiving this because you authored the thread.Message ID: @.***>