unable to use regex in grafana-flowchart prometheus query
Hi,
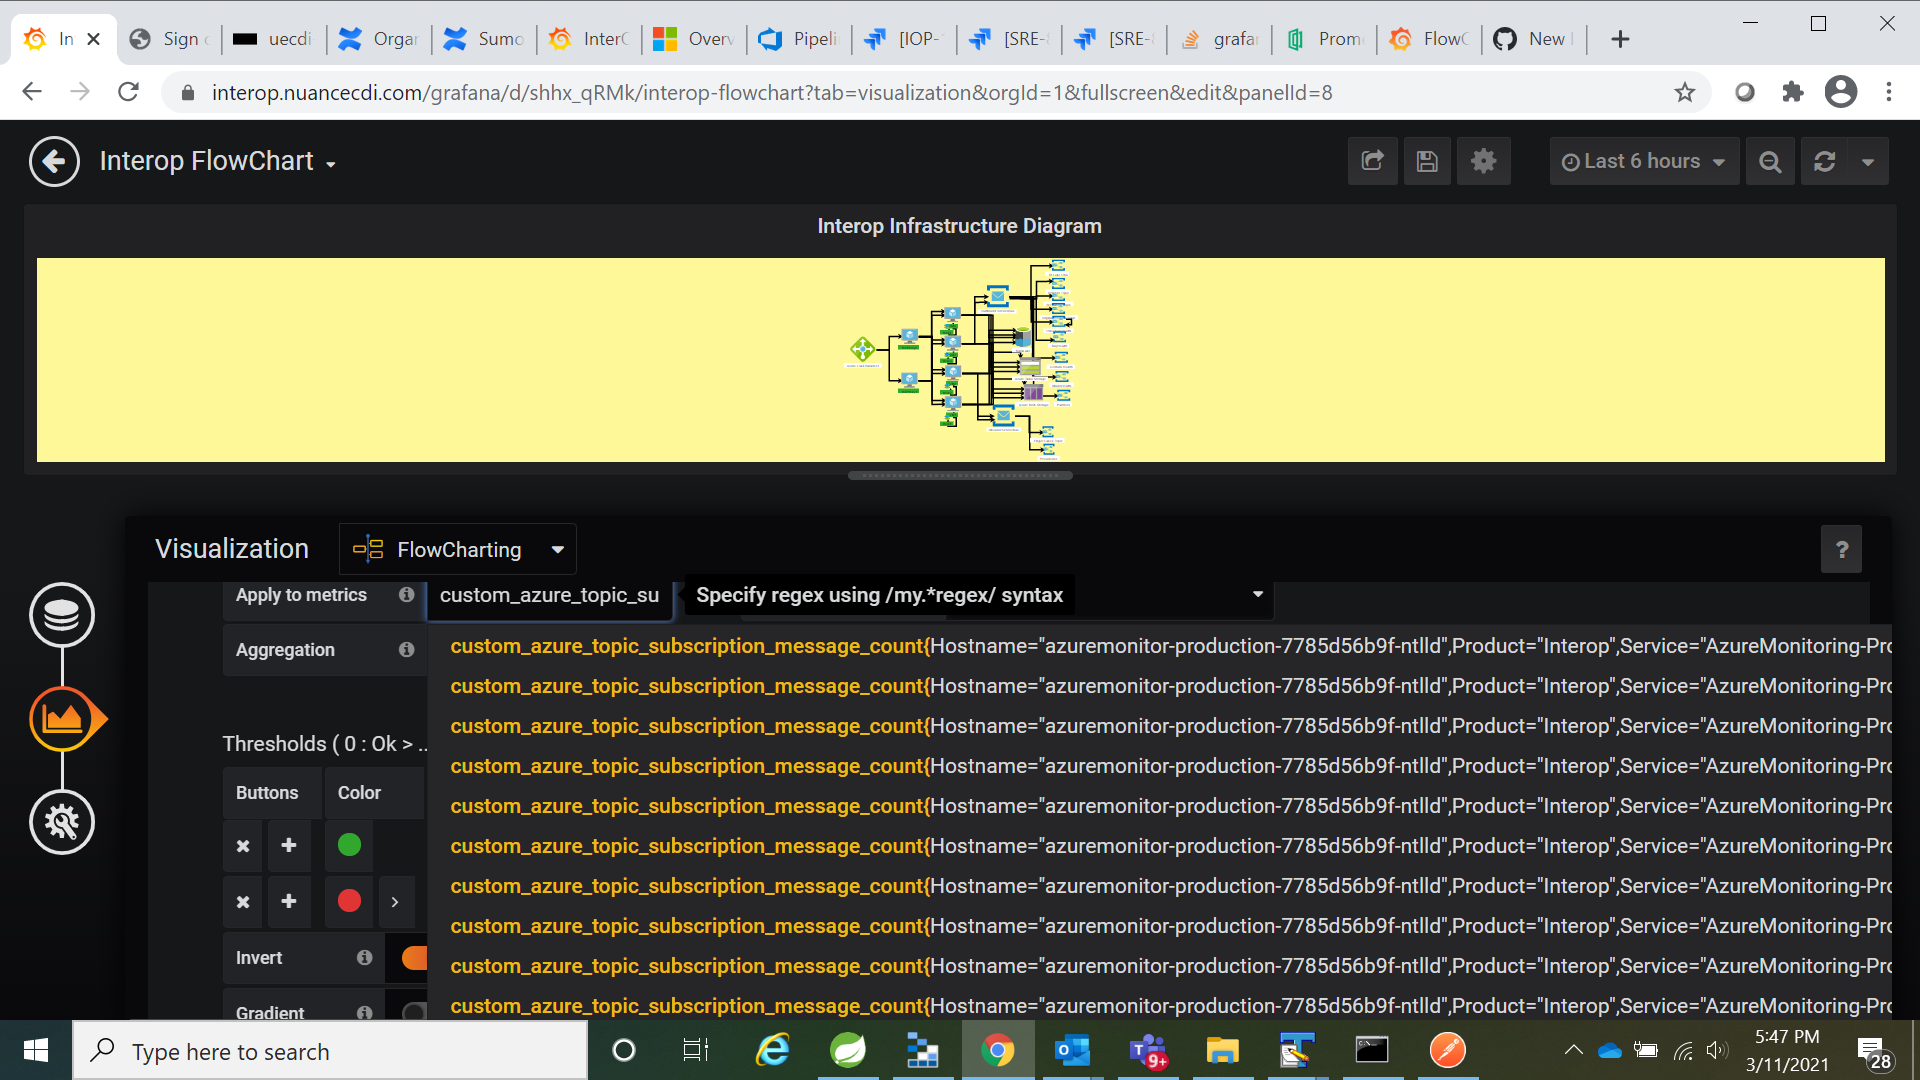
currently I am using grafana-flowchart to show status of different components of our application. Each component has its won metric and I use prometheus query to extract the correct metric in Apply to metric section. But the problem is since the component is deployed in kubernates everytime the server starts some of the tags like hostname and instance changes causing the metric to disappear . Hence I want to only select a specific tag in the query so that everytime restart of the server doesn't disrupt the metric.
For example in the metric below :
custom_azure_topic_subscription_message_count{Hostname="azuremonitor-production-7785d56b9f-ntlld",Product="MyProduct",Service="AzureMonitoring-Production",instance="10.210.41.29:8080",job="AzureMonitoring-Production",message_count_topic_subscription="myservicebus-ib1-premium_iop-ib-52358ae7-bd69-445c-8a42-1becd1b9eaef_CDE"}
I want to eliminate all tags except message_count_topic_subscription.
But as seen in the attached screenshot it doesn't allow me to restrict the tag or apply any regex .
Is this possible in flowchart ? If not when will this be fixed since this will not be very useful if it needs update on every restart of the server .
Thanks Debashish[
You have to use the legend of the metric to restrict what data is shown to flowcharting rules.
Then in flowchart rules use de /regexmatch/ syntaxe to specify matching criteria.
Easy. :-)